Climate Change points
Do you like facts? I hope so, because a lot of them are headed your way, pal.
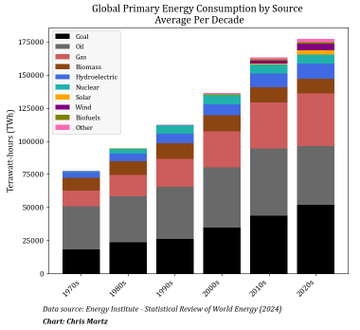
1. There is no “energy transition.” It's not here. The global demand for fossil fuels (i.e., coal, oil and natural gas) has increased over 117.5% since the 1970s. Fossil fuel consumption is at all-time record highs. For every six units of renewable energy technologies put online, less than one unit of fossil fuel is displaced (see Rather and Mahlik, 2023).
ourworldindata.org/energy-product
link.springer.com/article/10.100
2. Climate change is real, but the “climate crisis” is imaginary. The term is a political distinction that refers to how global warming will allegedly harm the state of human welfare. But, in spite of warming, there is not a single shred of evidence that the warming has had a negative impact on the human condition.
Here are some facts which you choose to ignore:
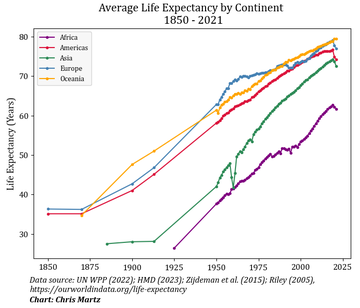
𝐀𝐯𝐞𝐫𝐚𝐠𝐞 𝐥𝐢𝐟𝐞 𝐞𝐱𝐩𝐞𝐜𝐭𝐚𝐧𝐜𝐲 𝐡𝐚𝐬 𝐦𝐨𝐫𝐞 𝐭𝐡𝐚𝐧 𝐝𝐨𝐮𝐛𝐥𝐞𝐝:
• Africa: +131.8% (2011-20 vs. 1925)
• Americas: +116.9% (2011-20 vs. 1850)
• Asia: +165.8% (2011-20 vs. 1885)
• Europe: +115.0% (2011-20 vs. 1850)
• Oceania: +124.9% (2011-20 vs. 1870)
ourworldindata.org/life-expectancy
The reason for this is because of fossil fuels, which, Have improved our standard of living by producing the electricity supplied to our homes to keep our lights on and HVAC running.
Produce the electricity and/or gas for our stoves to cook our food properly and reduce risk of becoming infected with foodborne pathogens.
Have improved public health by facilitating a clean running water supply and hygienic sewage treatment, in addition to enabling scientists to develop life-saving medications, vaccines and surgical procedures that would otherwise not exist.
Power automobiles, aircraft and other modes of transportation which make it easier for people to get access to better healthcare, better education and many other essential services.
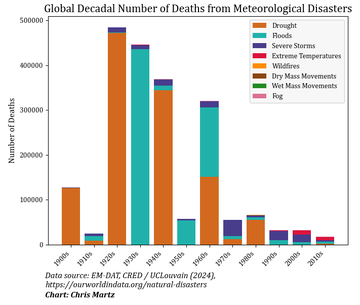
𝐃𝐞𝐚𝐭𝐡𝐬 𝐟𝐫𝐨𝐦 𝐰𝐞𝐚𝐭𝐡𝐞𝐫-𝐫𝐞𝐥𝐚𝐭𝐞𝐝 𝐧𝐚𝐭𝐮𝐫𝐚𝐥 𝐡𝐚𝐳𝐚𝐫𝐝𝐬 𝐚𝐫𝐞 𝐝𝐨𝐰𝐧 𝐦𝐨𝐫𝐞 𝐭𝐡𝐚𝐧 𝟗𝟎%.
The [decadal average] number of deaths attributed to weather hazards (e.g., severe storms, floods, droughts or extreme temperatures) have decreased by >96.2% since the 1920s. While this data does not reflect climate trends, it is a result of better warning coordination between officials and the general public. It also reflects advancements in forecast lead time, which has been enabled by powerful supercomputers that require fossil fuels to process data and use numerical weather prediction to print out forecasts. ourworldindata.org/grapher/decada
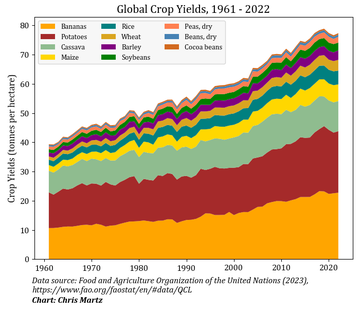
𝐆𝐥𝐨𝐛𝐚𝐥 𝐚𝐠𝐫𝐢𝐜𝐮𝐥𝐭𝐮𝐫𝐚𝐥 𝐩𝐫𝐨𝐝𝐮𝐜𝐭𝐢𝐯𝐢𝐭𝐲 𝐢𝐬 𝐚𝐭 𝐫𝐞𝐜𝐨𝐫𝐝 𝐡𝐢𝐠𝐡𝐬.
Contrary to popular belief, crop yields have been at “all-time” record highs [since FAO data began in 1961] during the last 10-years.
Bananas: +1,821.0%
Potatoes: +1,480.0%
Maize / corn: +2,448.7%
Rice: +2,073.3%
Wheat: +2,481.9%
Soybeans: +1,960.8%
Peas, dry: +1,650.3%
Beans, dry: +1,483.3%
Cocoa beans: +1,381.6%
fao.org/faostat/en/#da
These trends are largely a byproduct of genetic engineering high yield crop varieties which are more resistant to inclement weather and invasive insect species.
pmc.ncbi.nlm.nih.gov/articles/PMC42
However, some of these trends may be augmented by higher CO₂ concentrations in the atmosphere and a longer growing season in the middle latitudes, caused by global warming. Even the Environmental Protection Agency (EPA) of the U.S. admits this.
climatechange.chicago.gov/climate-impact


 More tornadoes? Stronger tornadoes? Same thing with floods, droughts and derechos, too?
Beat your chest and feel that pride now because you're about to be body bagged with facts.
More tornadoes? Stronger tornadoes? Same thing with floods, droughts and derechos, too?
Beat your chest and feel that pride now because you're about to be body bagged with facts.  Let's take a look at your claims one by one.
𝐓𝐎𝐑𝐍𝐀𝐃𝐎𝐄𝐒
Let's take a look at your claims one by one.
𝐓𝐎𝐑𝐍𝐀𝐃𝐎𝐄𝐒  While tornado 𝒓𝒆𝒑𝒐𝒓𝒕𝒔 have nearly doubled over the last 70 years, that does 𝒏𝒐𝒕 mean that actual tornado counts have increased. The increase in reporting has been driven almost entirely by 𝒊𝒏𝒄𝒓𝒆𝒂𝒔𝒆𝒅 𝒓𝒆𝒑𝒐𝒓𝒕𝒊𝒏𝒈 𝒐𝒇 𝒘𝒆𝒂𝒌 𝑭/𝑬𝑭𝟬 𝒕𝒐𝒓𝒏𝒂𝒅𝒐𝒆𝒔 and is 𝒏𝒐𝒕 a true climate-related trend.
The increase was gradual, albeit steady between 1954 and early-1990s due to rural population growth, which inevitably led to more spotter reports (e.g., Kunkel et al., 2013 and Tippett et al., 2015).
While tornado 𝒓𝒆𝒑𝒐𝒓𝒕𝒔 have nearly doubled over the last 70 years, that does 𝒏𝒐𝒕 mean that actual tornado counts have increased. The increase in reporting has been driven almost entirely by 𝒊𝒏𝒄𝒓𝒆𝒂𝒔𝒆𝒅 𝒓𝒆𝒑𝒐𝒓𝒕𝒊𝒏𝒈 𝒐𝒇 𝒘𝒆𝒂𝒌 𝑭/𝑬𝑭𝟬 𝒕𝒐𝒓𝒏𝒂𝒅𝒐𝒆𝒔 and is 𝒏𝒐𝒕 a true climate-related trend.
The increase was gradual, albeit steady between 1954 and early-1990s due to rural population growth, which inevitably led to more spotter reports (e.g., Kunkel et al., 2013 and Tippett et al., 2015). 
 journals.ametsoc.org/view/journals/
link.springer.com/article/10.100
The spurious jump that is observed in the early 1990s is accredited to the installation and operational use of the NEXRAD WSR-88D Doppler radar, which greatly improved tornado detection in the absence of spotter reports (e.g., Verbout et al., 2006).
journals.ametsoc.org/view/journals/
link.springer.com/article/10.100
The spurious jump that is observed in the early 1990s is accredited to the installation and operational use of the NEXRAD WSR-88D Doppler radar, which greatly improved tornado detection in the absence of spotter reports (e.g., Verbout et al., 2006).  journals.ametsoc.org/view/journals/
If F/EF0s are eliminated from the dataset, we can give a more historically accurate comparison between pre-1990 and post-1990 data by simply examining F/EF1+ tallies. If we do this, we find that,
✦ There has been 𝒏𝒐 measurable increase in annual F/EF1-5 tornado count in the U.S. since real-time data collection began in 1954 (NOAA SPC / Verbout et al., 2006).
✦ The number of strong-to-violent F/EF3+ tornadoes have decreased by >45% since 1960 (NOAA SPC).
spc.noaa.gov/wcm/data/1950-
journals.ametsoc.org/view/journals/
What's more, the number of days per year with at least one F/EF1+ tornado in the U.S. have 𝒅𝒆𝒄𝒓𝒆𝒂𝒔𝒆𝒅 since the 1970s. However, the number of days with ≥30 E/EF1+ counts have increased twofold over that same period, which might suggest that tornado outbreaks in the U.S. are increasing and becoming larger, as found in Moore (2017).
rmets.onlinelibrary.wiley.com/doi/10.1002/jo
However, NOAA proceeds with caution here.
journals.ametsoc.org/view/journals/
If F/EF0s are eliminated from the dataset, we can give a more historically accurate comparison between pre-1990 and post-1990 data by simply examining F/EF1+ tallies. If we do this, we find that,
✦ There has been 𝒏𝒐 measurable increase in annual F/EF1-5 tornado count in the U.S. since real-time data collection began in 1954 (NOAA SPC / Verbout et al., 2006).
✦ The number of strong-to-violent F/EF3+ tornadoes have decreased by >45% since 1960 (NOAA SPC).
spc.noaa.gov/wcm/data/1950-
journals.ametsoc.org/view/journals/
What's more, the number of days per year with at least one F/EF1+ tornado in the U.S. have 𝒅𝒆𝒄𝒓𝒆𝒂𝒔𝒆𝒅 since the 1970s. However, the number of days with ≥30 E/EF1+ counts have increased twofold over that same period, which might suggest that tornado outbreaks in the U.S. are increasing and becoming larger, as found in Moore (2017).
rmets.onlinelibrary.wiley.com/doi/10.1002/jo
However, NOAA proceeds with caution here.  They say that the aforementioned trend emerged after the NEXRAD WSR-88D Doppler radar network came online for operational forecasting use during the early-1990s, and no statistically significant trends in the number of days with ≥30 E/EF1+ has been detected in the most recent 30-year period. Therefore, increased detection of weaker tornadoes in outbreaks due to the changes in observation platforms is again the culprit.
sciencecouncil.noaa.gov/wp-content/upl
That was a bata-bata-swing and a miss.
They say that the aforementioned trend emerged after the NEXRAD WSR-88D Doppler radar network came online for operational forecasting use during the early-1990s, and no statistically significant trends in the number of days with ≥30 E/EF1+ has been detected in the most recent 30-year period. Therefore, increased detection of weaker tornadoes in outbreaks due to the changes in observation platforms is again the culprit.
sciencecouncil.noaa.gov/wp-content/upl
That was a bata-bata-swing and a miss.  Let's continue. . .
𝐑𝐈𝐕𝐄𝐑 𝐅𝐋𝐎𝐎𝐃𝐒 / 𝐅𝐋𝐀𝐒𝐇 𝐅𝐋𝐎𝐎𝐃𝐒
Let's continue. . .
𝐑𝐈𝐕𝐄𝐑 𝐅𝐋𝐎𝐎𝐃𝐒 / 𝐅𝐋𝐀𝐒𝐇 𝐅𝐋𝐎𝐎𝐃𝐒  The IPCC AR6 WG1 report summarizes what we know about floods and climate change nicely.
  In regard to fluvial (river) flooding. . .
On detection, Chapter 11, Section 5.2,
In regard to fluvial (river) flooding. . .
On detection, Chapter 11, Section 5.2,
 “𝑃𝑒𝑎𝑘 𝑓𝑙𝑜𝑤 𝑡𝑟𝑒𝑛𝑑𝑠 𝑎𝑟𝑒 𝑐ℎ𝑎𝑟𝑎𝑐𝑡𝑒𝑟𝑖𝑧𝑒𝑑 𝑏𝑦 𝒉𝒊𝒈𝒉 𝒓𝒆𝒈𝒊𝒐𝒏𝒂𝒍 𝒗𝒂𝒓𝒊𝒂𝒃𝒊𝒍𝒊𝒕𝒚 𝒂𝒏𝒅 𝒍𝒂𝒄𝒌 𝒐𝒗𝒆𝒓𝒂𝒍𝒍 𝒔𝒕𝒂𝒕𝒊𝒔𝒕𝒊𝒄𝒂𝒍 𝒔𝒊𝒈𝒏𝒊𝒇𝒊𝒄𝒂𝒏𝒄𝒆 𝑜𝑓 𝑎 𝑑𝑒𝑐𝑟𝑒𝑎𝑠𝑒 𝑜𝑟 𝑎𝑛 𝑖𝑛𝑐𝑟𝑒𝑎𝑠𝑒 𝑜𝑣𝑒𝑟 𝑡ℎ𝑒 𝑔𝑙𝑜𝑏𝑒 𝑎𝑠 𝑎 𝑤ℎ𝑜𝑙𝑒. 𝑂𝑓 𝑚𝑜𝑟𝑒 𝑡ℎ𝑎𝑛 3,500 𝑠𝑡𝑟𝑒𝑎𝑚𝑓𝑙𝑜𝑤 𝑠𝑡𝑎𝑡𝑖𝑜𝑛𝑠 𝑖𝑛 𝑡ℎ𝑒 𝑈𝑆𝐴, 𝑐𝑒𝑛𝑡𝑟𝑎𝑙 𝑎𝑛𝑑 𝑁𝑜𝑟𝑡ℎ𝑒𝑟𝑛 𝐸𝑢𝑟𝑜𝑝𝑒, 𝐴𝑓𝑟𝑖𝑐𝑎, 𝐵𝑟𝑎𝑧𝑖𝑙 𝑎𝑛𝑑 𝐴𝑢𝑠𝑡𝑟𝑎𝑙𝑖𝑎, 7.1% 𝑠𝑡𝑎𝑡𝑖𝑜𝑛𝑠 𝑠ℎ𝑜𝑤𝑒𝑑 𝑎 𝑠𝑖𝑔𝑛𝑖𝑓𝑖𝑐𝑎𝑛𝑡 𝑖𝑛𝑐𝑟𝑒𝑎𝑠𝑒, 𝑎𝑛𝑑 𝟏𝟏.𝟗% 𝒔𝒕𝒂𝒕𝒊𝒐𝒏𝒔 𝒔𝒉𝒐𝒘𝒆𝒅 𝒂 𝒔𝒊𝒈𝒏𝒊𝒇𝒊𝒄𝒂𝒏𝒕 𝒅𝒆𝒄𝒓𝒆𝒂𝒔𝒆 𝑖𝑛 𝑎𝑛𝑛𝑢𝑎𝑙 𝑚𝑎𝑥𝑖𝑚𝑢𝑚 𝑝𝑒𝑎𝑘 𝑓𝑙𝑜𝑤 𝑑𝑢𝑟𝑖𝑛𝑔 1961-2005.”
ipcc.ch/report/ar6/wg1
On attribution, Chapter 11, Section 5.4,
“𝐼𝑛 𝑠𝑢𝑚𝑚𝑎𝑟𝑦 𝑡ℎ𝑒𝑟𝑒 𝑖𝑠 𝒍𝒐𝒘 𝒄𝒐𝒏𝒇𝒊𝒅𝒆𝒏𝒄𝒆 𝑖𝑛 𝑡ℎ𝑒 ℎ𝑢𝑚𝑎𝑛 𝑖𝑛𝑓𝑙𝑢𝑒𝑛𝑐𝑒 𝑜𝑛 𝑡ℎ𝑒 𝑐ℎ𝑎𝑛𝑔𝑒𝑠 𝑖𝑛 ℎ𝑖𝑔ℎ 𝑟𝑖𝑣𝑒𝑟 𝑓𝑙𝑜𝑤𝑠 𝑜𝑛 𝑡ℎ𝑒 𝑔𝑙𝑜𝑏𝑎𝑙 𝑠𝑐𝑎𝑙𝑒. 𝐼𝑛 𝑔𝑒𝑛𝑒𝑟𝑎𝑙, 𝑡ℎ𝑒𝑟𝑒 𝑖𝑠 𝒍𝒐𝒘 𝒄𝒐𝒏𝒇𝒊𝒅𝒆𝒏𝒄𝒆 𝑖𝑛 𝑎𝑡𝑡𝑟𝑖𝑏𝑢𝑡𝑖𝑛𝑔 𝑐ℎ𝑎𝑛𝑔𝑒𝑠 𝑖𝑛 𝑡ℎ𝑒 𝑝𝑟𝑜𝑏𝑎𝑏𝑖𝑙𝑖𝑡𝑦 𝑜𝑟 𝑚𝑎𝑔𝑛𝑖𝑡𝑢𝑑𝑒 𝑜𝑓 𝑓𝑙𝑜𝑜𝑑 𝑒𝑣𝑒𝑛𝑡𝑠 𝑡𝑜 ℎ𝑢𝑚𝑎𝑛 𝑖𝑛𝑓𝑙𝑢𝑒𝑛𝑐𝑒 𝑏𝑒𝑐𝑎𝑢𝑠𝑒 𝑜𝑓 𝑎 𝑙𝑖𝑚𝑖𝑡𝑒𝑑 𝑛𝑢𝑚𝑏𝑒𝑟 𝑜𝑓 𝑠𝑡𝑢𝑑𝑖𝑒𝑠, 𝑑𝑖𝑓𝑓𝑒𝑟𝑒𝑛𝑐𝑒𝑠 𝑖𝑛 𝑡ℎ𝑒 𝑟𝑒𝑠𝑢𝑙𝑡𝑠 𝑜𝑓 𝑡ℎ𝑒𝑠𝑒 𝑠𝑡𝑢𝑑𝑖𝑒𝑠 𝑎𝑛𝑑 𝑙𝑎𝑟𝑔𝑒 𝑚𝑜𝑑𝑒𝑙𝑙𝑖𝑛𝑔 𝑢𝑛𝑐𝑒𝑟𝑡𝑎𝑖𝑛𝑡𝑖𝑒𝑠.”
ipcc.ch/report/ar6/wg1
In regard to pluvial (flash) flooding, IPCC AR6 WG1 has this to say in their FAQ,
“𝐴𝑛 𝑖𝑛𝑐𝑟𝑒𝑎𝑠𝑒𝑑 𝑖𝑛𝑡𝑒𝑛𝑠𝑖𝑡𝑦 𝑎𝑛𝑑 𝑓𝑟𝑒𝑞𝑢𝑒𝑛𝑐𝑦 𝑜𝑓 𝑟𝑒𝑐𝑜𝑟𝑑-𝑏𝑟𝑒𝑎𝑘𝑖𝑛𝑔 𝑑𝑎𝑖𝑙𝑦 𝑟𝑎𝑖𝑛𝑓𝑎𝑙𝑙 ℎ𝑎𝑠 𝑏𝑒𝑒𝑛 𝑑𝑒𝑡𝑒𝑐𝑡𝑒𝑑 𝑓𝑜𝑟 𝑚𝑢𝑐ℎ 𝑜𝑓 𝑡ℎ𝑒 𝑙𝑎𝑛𝑑 𝑠𝑢𝑟𝑓𝑎𝑐𝑒 𝑤ℎ𝑒𝑟𝑒 𝑔𝑜𝑜𝑑 𝑜𝑏𝑠𝑒𝑟𝑣𝑎𝑡𝑖𝑜𝑛𝑎𝑙 𝑟𝑒𝑐𝑜𝑟𝑑𝑠 𝑒𝑥𝑖𝑠𝑡, 𝑎𝑛𝑑 𝑡ℎ𝑖𝑠 𝑐𝑎𝑛 𝑜𝑛𝑙𝑦 𝑏𝑒 𝑒𝑥𝑝𝑙𝑎𝑖𝑛𝑒𝑑 𝑏𝑦 ℎ𝑢𝑚𝑎𝑛-𝑐𝑎𝑢𝑠𝑒𝑑 𝑖𝑛𝑐𝑟𝑒𝑎𝑠𝑒𝑠 𝑖𝑛 𝑎𝑡𝑚𝑜𝑠𝑝ℎ𝑒𝑟𝑖𝑐 𝑔𝑟𝑒𝑒𝑛ℎ𝑜𝑢𝑠𝑒 𝑔𝑎𝑠 𝑐𝑜𝑛𝑐𝑒𝑛𝑡𝑟𝑎𝑡𝑖𝑜𝑛𝑠... 𝐻𝑜𝑤𝑒𝑣𝑒𝑟, 𝒉𝒆𝒂𝒗𝒊𝒆𝒓 𝒓𝒂𝒊𝒏𝒇𝒂𝒍𝒍 𝒅𝒐𝒆𝒔 𝒏𝒐𝒕 𝒂𝒍𝒘𝒂𝒚𝒔 𝒍𝒆𝒂𝒅 𝒕𝒐 𝒈𝒓𝒆𝒂𝒕𝒆𝒓 𝒇𝒍𝒐𝒐𝒅𝒊𝒏𝒈. 𝑇ℎ𝑖𝑠 𝑖𝑠 𝑏𝑒𝑐𝑎𝑢𝑠𝑒 𝑓𝑙𝑜𝑜𝑑𝑖𝑛𝑔 𝑎𝑙𝑠𝑜 𝑑𝑒𝑝𝑒𝑛𝑑𝑠 𝑢𝑝𝑜𝑛 𝑡ℎ𝑒 𝑡𝑦𝑝𝑒 𝑜𝑓 𝑟𝑖𝑣𝑒𝑟 𝑏𝑎𝑠𝑖𝑛, 𝑡ℎ𝑒 𝑠𝑢𝑟𝑓𝑎𝑐𝑒 𝑙𝑎𝑛𝑑𝑠𝑐𝑎𝑝𝑒, 𝑡ℎ𝑒 𝑒𝑥𝑡𝑒𝑛𝑡 𝑎𝑛𝑑 𝑑𝑢𝑟𝑎𝑡𝑖𝑜𝑛 𝑜𝑓 𝑡ℎ𝑒 𝑟𝑎𝑖𝑛𝑓𝑎𝑙𝑙, 𝑎𝑛𝑑 ℎ𝑜𝑤 𝑤𝑒𝑡 𝑡ℎ𝑒 𝑔𝑟𝑜𝑢𝑛𝑑 𝑖𝑠 𝑏𝑒𝑓𝑜𝑟𝑒 𝑡ℎ𝑒 𝑟𝑎𝑖𝑛𝑓𝑎𝑙𝑙 𝑒𝑣𝑒𝑛𝑡... 𝐴 𝒎𝒊𝒙 𝒐𝒇 𝒃𝒐𝒕𝒉 𝒊𝒏𝒄𝒓𝒆𝒂𝒔𝒆𝒔 𝒂𝒏𝒅 𝒅𝒆𝒄𝒓𝒆𝒂𝒔𝒆𝒔 𝒊𝒏 𝒇𝒍𝒐𝒐𝒅𝒊𝒏𝒈 𝒉𝒂𝒗𝒆 𝒃𝒆𝒆𝒏 𝒐𝒃𝒔𝒆𝒓𝒗𝒆𝒅 𝑖𝑛 𝑠𝑜𝑚𝑒 𝑟𝑒𝑔𝑖𝑜𝑛𝑠 𝑎𝑛𝑑 𝑡ℎ𝑒𝑠𝑒 𝑐ℎ𝑎𝑛𝑔𝑒𝑠 ℎ𝑎𝑣𝑒 𝑏𝑒𝑒𝑛 𝑎𝑡𝑡𝑟𝑖𝑏𝑢𝑡𝑒𝑑 𝑡𝑜 𝑚𝑢𝑙𝑡𝑖𝑝𝑙𝑒 𝑐𝑎𝑢𝑠𝑒𝑠, 𝑖𝑛𝑐𝑙𝑢𝑑𝑖𝑛𝑔 𝑐ℎ𝑎𝑛𝑔𝑒𝑠 𝑖𝑛 𝑠𝑛𝑜𝑤𝑚𝑒𝑙𝑡, 𝑠𝑜𝑖𝑙 𝑚𝑜𝑖𝑠𝑡𝑢𝑟𝑒 𝑎𝑛𝑑 𝑟𝑎𝑖𝑛𝑓𝑎𝑙𝑙”
ipcc.ch/report/ar6/wg1
Once again, your claim falls apart like soup crackers when stacked against observational data.
Strike two!
𝐃𝐑𝐎𝐔𝐆𝐇𝐓𝐒
“𝑃𝑒𝑎𝑘 𝑓𝑙𝑜𝑤 𝑡𝑟𝑒𝑛𝑑𝑠 𝑎𝑟𝑒 𝑐ℎ𝑎𝑟𝑎𝑐𝑡𝑒𝑟𝑖𝑧𝑒𝑑 𝑏𝑦 𝒉𝒊𝒈𝒉 𝒓𝒆𝒈𝒊𝒐𝒏𝒂𝒍 𝒗𝒂𝒓𝒊𝒂𝒃𝒊𝒍𝒊𝒕𝒚 𝒂𝒏𝒅 𝒍𝒂𝒄𝒌 𝒐𝒗𝒆𝒓𝒂𝒍𝒍 𝒔𝒕𝒂𝒕𝒊𝒔𝒕𝒊𝒄𝒂𝒍 𝒔𝒊𝒈𝒏𝒊𝒇𝒊𝒄𝒂𝒏𝒄𝒆 𝑜𝑓 𝑎 𝑑𝑒𝑐𝑟𝑒𝑎𝑠𝑒 𝑜𝑟 𝑎𝑛 𝑖𝑛𝑐𝑟𝑒𝑎𝑠𝑒 𝑜𝑣𝑒𝑟 𝑡ℎ𝑒 𝑔𝑙𝑜𝑏𝑒 𝑎𝑠 𝑎 𝑤ℎ𝑜𝑙𝑒. 𝑂𝑓 𝑚𝑜𝑟𝑒 𝑡ℎ𝑎𝑛 3,500 𝑠𝑡𝑟𝑒𝑎𝑚𝑓𝑙𝑜𝑤 𝑠𝑡𝑎𝑡𝑖𝑜𝑛𝑠 𝑖𝑛 𝑡ℎ𝑒 𝑈𝑆𝐴, 𝑐𝑒𝑛𝑡𝑟𝑎𝑙 𝑎𝑛𝑑 𝑁𝑜𝑟𝑡ℎ𝑒𝑟𝑛 𝐸𝑢𝑟𝑜𝑝𝑒, 𝐴𝑓𝑟𝑖𝑐𝑎, 𝐵𝑟𝑎𝑧𝑖𝑙 𝑎𝑛𝑑 𝐴𝑢𝑠𝑡𝑟𝑎𝑙𝑖𝑎, 7.1% 𝑠𝑡𝑎𝑡𝑖𝑜𝑛𝑠 𝑠ℎ𝑜𝑤𝑒𝑑 𝑎 𝑠𝑖𝑔𝑛𝑖𝑓𝑖𝑐𝑎𝑛𝑡 𝑖𝑛𝑐𝑟𝑒𝑎𝑠𝑒, 𝑎𝑛𝑑 𝟏𝟏.𝟗% 𝒔𝒕𝒂𝒕𝒊𝒐𝒏𝒔 𝒔𝒉𝒐𝒘𝒆𝒅 𝒂 𝒔𝒊𝒈𝒏𝒊𝒇𝒊𝒄𝒂𝒏𝒕 𝒅𝒆𝒄𝒓𝒆𝒂𝒔𝒆 𝑖𝑛 𝑎𝑛𝑛𝑢𝑎𝑙 𝑚𝑎𝑥𝑖𝑚𝑢𝑚 𝑝𝑒𝑎𝑘 𝑓𝑙𝑜𝑤 𝑑𝑢𝑟𝑖𝑛𝑔 1961-2005.”
ipcc.ch/report/ar6/wg1
On attribution, Chapter 11, Section 5.4,
“𝐼𝑛 𝑠𝑢𝑚𝑚𝑎𝑟𝑦 𝑡ℎ𝑒𝑟𝑒 𝑖𝑠 𝒍𝒐𝒘 𝒄𝒐𝒏𝒇𝒊𝒅𝒆𝒏𝒄𝒆 𝑖𝑛 𝑡ℎ𝑒 ℎ𝑢𝑚𝑎𝑛 𝑖𝑛𝑓𝑙𝑢𝑒𝑛𝑐𝑒 𝑜𝑛 𝑡ℎ𝑒 𝑐ℎ𝑎𝑛𝑔𝑒𝑠 𝑖𝑛 ℎ𝑖𝑔ℎ 𝑟𝑖𝑣𝑒𝑟 𝑓𝑙𝑜𝑤𝑠 𝑜𝑛 𝑡ℎ𝑒 𝑔𝑙𝑜𝑏𝑎𝑙 𝑠𝑐𝑎𝑙𝑒. 𝐼𝑛 𝑔𝑒𝑛𝑒𝑟𝑎𝑙, 𝑡ℎ𝑒𝑟𝑒 𝑖𝑠 𝒍𝒐𝒘 𝒄𝒐𝒏𝒇𝒊𝒅𝒆𝒏𝒄𝒆 𝑖𝑛 𝑎𝑡𝑡𝑟𝑖𝑏𝑢𝑡𝑖𝑛𝑔 𝑐ℎ𝑎𝑛𝑔𝑒𝑠 𝑖𝑛 𝑡ℎ𝑒 𝑝𝑟𝑜𝑏𝑎𝑏𝑖𝑙𝑖𝑡𝑦 𝑜𝑟 𝑚𝑎𝑔𝑛𝑖𝑡𝑢𝑑𝑒 𝑜𝑓 𝑓𝑙𝑜𝑜𝑑 𝑒𝑣𝑒𝑛𝑡𝑠 𝑡𝑜 ℎ𝑢𝑚𝑎𝑛 𝑖𝑛𝑓𝑙𝑢𝑒𝑛𝑐𝑒 𝑏𝑒𝑐𝑎𝑢𝑠𝑒 𝑜𝑓 𝑎 𝑙𝑖𝑚𝑖𝑡𝑒𝑑 𝑛𝑢𝑚𝑏𝑒𝑟 𝑜𝑓 𝑠𝑡𝑢𝑑𝑖𝑒𝑠, 𝑑𝑖𝑓𝑓𝑒𝑟𝑒𝑛𝑐𝑒𝑠 𝑖𝑛 𝑡ℎ𝑒 𝑟𝑒𝑠𝑢𝑙𝑡𝑠 𝑜𝑓 𝑡ℎ𝑒𝑠𝑒 𝑠𝑡𝑢𝑑𝑖𝑒𝑠 𝑎𝑛𝑑 𝑙𝑎𝑟𝑔𝑒 𝑚𝑜𝑑𝑒𝑙𝑙𝑖𝑛𝑔 𝑢𝑛𝑐𝑒𝑟𝑡𝑎𝑖𝑛𝑡𝑖𝑒𝑠.”
ipcc.ch/report/ar6/wg1
In regard to pluvial (flash) flooding, IPCC AR6 WG1 has this to say in their FAQ,
“𝐴𝑛 𝑖𝑛𝑐𝑟𝑒𝑎𝑠𝑒𝑑 𝑖𝑛𝑡𝑒𝑛𝑠𝑖𝑡𝑦 𝑎𝑛𝑑 𝑓𝑟𝑒𝑞𝑢𝑒𝑛𝑐𝑦 𝑜𝑓 𝑟𝑒𝑐𝑜𝑟𝑑-𝑏𝑟𝑒𝑎𝑘𝑖𝑛𝑔 𝑑𝑎𝑖𝑙𝑦 𝑟𝑎𝑖𝑛𝑓𝑎𝑙𝑙 ℎ𝑎𝑠 𝑏𝑒𝑒𝑛 𝑑𝑒𝑡𝑒𝑐𝑡𝑒𝑑 𝑓𝑜𝑟 𝑚𝑢𝑐ℎ 𝑜𝑓 𝑡ℎ𝑒 𝑙𝑎𝑛𝑑 𝑠𝑢𝑟𝑓𝑎𝑐𝑒 𝑤ℎ𝑒𝑟𝑒 𝑔𝑜𝑜𝑑 𝑜𝑏𝑠𝑒𝑟𝑣𝑎𝑡𝑖𝑜𝑛𝑎𝑙 𝑟𝑒𝑐𝑜𝑟𝑑𝑠 𝑒𝑥𝑖𝑠𝑡, 𝑎𝑛𝑑 𝑡ℎ𝑖𝑠 𝑐𝑎𝑛 𝑜𝑛𝑙𝑦 𝑏𝑒 𝑒𝑥𝑝𝑙𝑎𝑖𝑛𝑒𝑑 𝑏𝑦 ℎ𝑢𝑚𝑎𝑛-𝑐𝑎𝑢𝑠𝑒𝑑 𝑖𝑛𝑐𝑟𝑒𝑎𝑠𝑒𝑠 𝑖𝑛 𝑎𝑡𝑚𝑜𝑠𝑝ℎ𝑒𝑟𝑖𝑐 𝑔𝑟𝑒𝑒𝑛ℎ𝑜𝑢𝑠𝑒 𝑔𝑎𝑠 𝑐𝑜𝑛𝑐𝑒𝑛𝑡𝑟𝑎𝑡𝑖𝑜𝑛𝑠... 𝐻𝑜𝑤𝑒𝑣𝑒𝑟, 𝒉𝒆𝒂𝒗𝒊𝒆𝒓 𝒓𝒂𝒊𝒏𝒇𝒂𝒍𝒍 𝒅𝒐𝒆𝒔 𝒏𝒐𝒕 𝒂𝒍𝒘𝒂𝒚𝒔 𝒍𝒆𝒂𝒅 𝒕𝒐 𝒈𝒓𝒆𝒂𝒕𝒆𝒓 𝒇𝒍𝒐𝒐𝒅𝒊𝒏𝒈. 𝑇ℎ𝑖𝑠 𝑖𝑠 𝑏𝑒𝑐𝑎𝑢𝑠𝑒 𝑓𝑙𝑜𝑜𝑑𝑖𝑛𝑔 𝑎𝑙𝑠𝑜 𝑑𝑒𝑝𝑒𝑛𝑑𝑠 𝑢𝑝𝑜𝑛 𝑡ℎ𝑒 𝑡𝑦𝑝𝑒 𝑜𝑓 𝑟𝑖𝑣𝑒𝑟 𝑏𝑎𝑠𝑖𝑛, 𝑡ℎ𝑒 𝑠𝑢𝑟𝑓𝑎𝑐𝑒 𝑙𝑎𝑛𝑑𝑠𝑐𝑎𝑝𝑒, 𝑡ℎ𝑒 𝑒𝑥𝑡𝑒𝑛𝑡 𝑎𝑛𝑑 𝑑𝑢𝑟𝑎𝑡𝑖𝑜𝑛 𝑜𝑓 𝑡ℎ𝑒 𝑟𝑎𝑖𝑛𝑓𝑎𝑙𝑙, 𝑎𝑛𝑑 ℎ𝑜𝑤 𝑤𝑒𝑡 𝑡ℎ𝑒 𝑔𝑟𝑜𝑢𝑛𝑑 𝑖𝑠 𝑏𝑒𝑓𝑜𝑟𝑒 𝑡ℎ𝑒 𝑟𝑎𝑖𝑛𝑓𝑎𝑙𝑙 𝑒𝑣𝑒𝑛𝑡... 𝐴 𝒎𝒊𝒙 𝒐𝒇 𝒃𝒐𝒕𝒉 𝒊𝒏𝒄𝒓𝒆𝒂𝒔𝒆𝒔 𝒂𝒏𝒅 𝒅𝒆𝒄𝒓𝒆𝒂𝒔𝒆𝒔 𝒊𝒏 𝒇𝒍𝒐𝒐𝒅𝒊𝒏𝒈 𝒉𝒂𝒗𝒆 𝒃𝒆𝒆𝒏 𝒐𝒃𝒔𝒆𝒓𝒗𝒆𝒅 𝑖𝑛 𝑠𝑜𝑚𝑒 𝑟𝑒𝑔𝑖𝑜𝑛𝑠 𝑎𝑛𝑑 𝑡ℎ𝑒𝑠𝑒 𝑐ℎ𝑎𝑛𝑔𝑒𝑠 ℎ𝑎𝑣𝑒 𝑏𝑒𝑒𝑛 𝑎𝑡𝑡𝑟𝑖𝑏𝑢𝑡𝑒𝑑 𝑡𝑜 𝑚𝑢𝑙𝑡𝑖𝑝𝑙𝑒 𝑐𝑎𝑢𝑠𝑒𝑠, 𝑖𝑛𝑐𝑙𝑢𝑑𝑖𝑛𝑔 𝑐ℎ𝑎𝑛𝑔𝑒𝑠 𝑖𝑛 𝑠𝑛𝑜𝑤𝑚𝑒𝑙𝑡, 𝑠𝑜𝑖𝑙 𝑚𝑜𝑖𝑠𝑡𝑢𝑟𝑒 𝑎𝑛𝑑 𝑟𝑎𝑖𝑛𝑓𝑎𝑙𝑙”
ipcc.ch/report/ar6/wg1
Once again, your claim falls apart like soup crackers when stacked against observational data.
Strike two!
𝐃𝐑𝐎𝐔𝐆𝐇𝐓𝐒  Here's what IPCC AR6 WG1 has to say.
On detection, Chapter 11, Section 6.4.5,
“𝑇ℎ𝑒𝑟𝑒 𝑖𝑠 𝒍𝒐𝒘 𝒄𝒐𝒏𝒇𝒊𝒅𝒆𝒏𝒄𝒆 𝑡ℎ𝑎𝑡 ℎ𝑢𝑚𝑎𝑛 𝑖𝑛𝑓𝑙𝑢𝑒𝑛𝑐𝑒 ℎ𝑎𝑠 𝑎𝑓𝑓𝑒𝑐𝑡𝑒𝑑 𝑡𝑟𝑒𝑛𝑑𝑠 𝑖𝑛 𝒎𝒆𝒕𝒆𝒐𝒓𝒐𝒍𝒐𝒈𝒊𝒄𝒂𝒍 𝒅𝒓𝒐𝒖𝒈𝒉𝒕𝒔 𝑖𝑛 𝑚𝑜𝑠𝑡 𝑟𝑒𝑔𝑖𝑜𝑛𝑠. . . 𝑇ℎ𝑒𝑟𝑒 𝑖𝑠𝒎𝒆𝒅𝒊𝒖𝒎 𝒄𝒐𝒏𝒇𝒊𝒅𝒆𝒏𝒄𝒆 𝑡ℎ𝑎𝑡 ℎ𝑢𝑚𝑎𝑛-𝑖𝑛𝑑𝑢𝑐𝑒𝑑 𝑐𝑙𝑖𝑚𝑎𝑡𝑒 𝑐ℎ𝑎𝑛𝑔𝑒 ℎ𝑎𝑠 𝑐𝑜𝑛𝑡𝑟𝑖𝑏𝑢𝑡𝑒𝑑 𝑡𝑜 𝒊𝒏𝒄𝒓𝒆𝒂𝒔𝒊𝒏𝒈 𝒕𝒓𝒆𝒏𝒅𝒔 𝑖𝑛 𝑡ℎ𝑒 𝑝𝑟𝑜𝑏𝑎𝑏𝑖𝑙𝑖𝑡𝑦 𝑜𝑟 𝑖𝑛𝑡𝑒𝑛𝑠𝑖𝑡𝑦 𝑜𝑓 𝑟𝑒𝑐𝑒𝑛𝑡 𝒂𝒈𝒓𝒊𝒄𝒖𝒍𝒕𝒖𝒓𝒂𝒍 𝑎𝑛𝑑 𝒆𝒄𝒐𝒍𝒐𝒈𝒊𝒄𝒂𝒍 𝒅𝒓𝒐𝒖𝒈𝒉𝒕𝒔, 𝑙𝑒𝑎𝑑𝑖𝑛𝑔 𝑡𝑜 𝑎𝑛 𝑖𝑛𝑐𝑟𝑒𝑎𝑠𝑒 𝑜𝑓 𝑡ℎ𝑒 𝑎𝑓𝑓𝑒𝑐𝑡𝑒𝑑 𝑙𝑎𝑛𝑑 𝑎𝑟𝑒𝑎. 𝐻𝑢𝑚𝑎𝑛-𝑖𝑛𝑑𝑢𝑒𝑑 𝑐𝑙𝑖𝑚𝑎𝑡𝑒 𝑐ℎ𝑎𝑛𝑔𝑒 ℎ𝑎𝑠 𝑐𝑜𝑛𝑡𝑟𝑖𝑏𝑢𝑡𝑒𝑑 𝑡𝑜 𝑔𝑙𝑜𝑏𝑎𝑙-𝑠𝑐𝑎𝑙𝑒 𝑐ℎ𝑎𝑛𝑔𝑒 𝑖𝑛 𝑙𝑜𝑤 𝑓𝑙𝑜𝑤, 𝑏𝑢𝑡 𝒉𝒖𝒎𝒂𝒏 𝒘𝒂𝒕𝒆𝒓 𝒎𝒂𝒏𝒂𝒈𝒆𝒎𝒆𝒏𝒕 𝒂𝒏𝒅 𝒍𝒂𝒏𝒅-𝒖𝒔𝒆 𝒄𝒉𝒂𝒏𝒈𝒆𝒔 𝒂𝒓𝒆 𝒂𝒍𝒔𝒐 𝒊𝒎𝒑𝒐𝒓𝒕𝒂𝒏𝒕 𝒅𝒓𝒊𝒗𝒆𝒓𝒔.”
ipcc.ch/report/ar6/wg1
As a supplement, Vicente-Serrano et al. (2022) examined temporal changes in various drought types. Their analysis concluded similarly that,
“𝑨 𝒈𝒍𝒐𝒃𝒂𝒍 𝒊𝒏𝒄𝒓𝒆𝒂𝒔𝒆 𝒊𝒏 𝒕𝒉𝒆 𝒔𝒆𝒗𝒆𝒓𝒊𝒕𝒚 𝒐𝒇 𝒎𝒆𝒕𝒆𝒐𝒓𝒐𝒍𝒐𝒈𝒊𝒄𝒂𝒍 𝒅𝒓𝒐𝒖𝒈𝒉𝒕 𝒊𝒔 𝒏𝒐𝒕 𝒔𝒖𝒑𝒑𝒐𝒓𝒕𝒆𝒅 𝑏𝑦 𝑡ℎ𝑒 𝑎𝑛𝑎𝑙𝑦𝑠𝑖𝑠 𝑜𝑓 𝑝𝑟𝑒𝑐𝑖𝑝𝑖𝑡𝑎𝑡𝑖𝑜𝑛 𝑑𝑒𝑓𝑖𝑐𝑖𝑡𝑠, 𝑎𝑠 𝑜𝑛𝑙𝑦 𝑎 𝑓𝑒𝑤 𝑟𝑒𝑔𝑖𝑜𝑛𝑠 𝑜𝑓 𝑡ℎ𝑒 𝑤𝑜𝑟𝑙𝑑 𝑠ℎ𝑜𝑤 𝑎𝑛 𝑖𝑛𝑐𝑟𝑒𝑎𝑠𝑒 𝑖𝑛 𝑡ℎ𝑒 𝑠𝑒𝑣𝑒𝑟𝑖𝑡𝑦 𝑜𝑓 𝑚𝑒𝑡𝑒𝑜𝑟𝑜𝑙𝑜𝑔𝑖𝑐𝑎𝑙 𝑑𝑟𝑜𝑢𝑔ℎ𝑡𝑠.”
Additionally, the study found that changes in hydrological droughts were not due to human-caused climate change, but instead were related to other man-made influences such as land use change,
“𝑰𝒏𝒄𝒓𝒆𝒂𝒔𝒆𝒔 𝑖𝑛 𝑡ℎ𝑒 𝑓𝑟𝑒𝑞𝑢𝑒𝑛𝑐𝑦 𝑎𝑛𝑑 𝑠𝑒𝑣𝑒𝑟𝑖𝑡𝑦 𝑜𝑓 𝒉𝒚𝒅𝒓𝒐𝒍𝒐𝒈𝒊𝒄𝒂𝒍 𝒅𝒓𝒐𝒖𝒈𝒉𝒕𝒔 𝑐𝑎𝑛 𝑏𝑒 𝑡𝑟𝑎𝑐𝑒𝑑 𝑖𝑛 𝑝𝑎𝑟𝑡 𝑡𝑜 ℎ𝑢𝑚𝑎𝑛 𝑎𝑐𝑡𝑖𝑣𝑖𝑡𝑖𝑒𝑠 𝑠𝑢𝑐ℎ 𝑎𝑠 𝒍𝒂𝒏𝒅 𝒖𝒔𝒆 𝒄𝒉𝒂𝒏𝒈𝒆 𝒂𝒏𝒅 𝒂𝒈𝒓𝒊𝒄𝒖𝒍𝒕𝒖𝒓𝒂𝒍 𝒊𝒏𝒕𝒆𝒏𝒔𝒊𝒇𝒊𝒄𝒂𝒕𝒊𝒐𝒏 (𝑒.𝑔., 𝑡ℎ𝑒 𝑀𝑒𝑑𝑖𝑡𝑒𝑟𝑟𝑎𝑛𝑒𝑎𝑛 𝑎𝑟𝑒𝑎, 𝑁𝑜𝑟𝑡ℎ𝑒𝑎𝑠𝑡 𝐵𝑟𝑎𝑧𝑖𝑙).”
royalsocietypublishing.org/doi/10.1098/rs
Strike three!
You're out. But, I'll make that one a ball and give you one more shot.
𝐃𝐄𝐑𝐄𝐂𝐇𝐎𝐒 / 𝐂𝐎𝐍𝐕𝐄𝐂𝐓𝐈𝐕𝐄 𝐒𝐓𝐎𝐑𝐌𝐒
Here's what IPCC AR6 WG1 has to say.
On detection, Chapter 11, Section 6.4.5,
“𝑇ℎ𝑒𝑟𝑒 𝑖𝑠 𝒍𝒐𝒘 𝒄𝒐𝒏𝒇𝒊𝒅𝒆𝒏𝒄𝒆 𝑡ℎ𝑎𝑡 ℎ𝑢𝑚𝑎𝑛 𝑖𝑛𝑓𝑙𝑢𝑒𝑛𝑐𝑒 ℎ𝑎𝑠 𝑎𝑓𝑓𝑒𝑐𝑡𝑒𝑑 𝑡𝑟𝑒𝑛𝑑𝑠 𝑖𝑛 𝒎𝒆𝒕𝒆𝒐𝒓𝒐𝒍𝒐𝒈𝒊𝒄𝒂𝒍 𝒅𝒓𝒐𝒖𝒈𝒉𝒕𝒔 𝑖𝑛 𝑚𝑜𝑠𝑡 𝑟𝑒𝑔𝑖𝑜𝑛𝑠. . . 𝑇ℎ𝑒𝑟𝑒 𝑖𝑠𝒎𝒆𝒅𝒊𝒖𝒎 𝒄𝒐𝒏𝒇𝒊𝒅𝒆𝒏𝒄𝒆 𝑡ℎ𝑎𝑡 ℎ𝑢𝑚𝑎𝑛-𝑖𝑛𝑑𝑢𝑐𝑒𝑑 𝑐𝑙𝑖𝑚𝑎𝑡𝑒 𝑐ℎ𝑎𝑛𝑔𝑒 ℎ𝑎𝑠 𝑐𝑜𝑛𝑡𝑟𝑖𝑏𝑢𝑡𝑒𝑑 𝑡𝑜 𝒊𝒏𝒄𝒓𝒆𝒂𝒔𝒊𝒏𝒈 𝒕𝒓𝒆𝒏𝒅𝒔 𝑖𝑛 𝑡ℎ𝑒 𝑝𝑟𝑜𝑏𝑎𝑏𝑖𝑙𝑖𝑡𝑦 𝑜𝑟 𝑖𝑛𝑡𝑒𝑛𝑠𝑖𝑡𝑦 𝑜𝑓 𝑟𝑒𝑐𝑒𝑛𝑡 𝒂𝒈𝒓𝒊𝒄𝒖𝒍𝒕𝒖𝒓𝒂𝒍 𝑎𝑛𝑑 𝒆𝒄𝒐𝒍𝒐𝒈𝒊𝒄𝒂𝒍 𝒅𝒓𝒐𝒖𝒈𝒉𝒕𝒔, 𝑙𝑒𝑎𝑑𝑖𝑛𝑔 𝑡𝑜 𝑎𝑛 𝑖𝑛𝑐𝑟𝑒𝑎𝑠𝑒 𝑜𝑓 𝑡ℎ𝑒 𝑎𝑓𝑓𝑒𝑐𝑡𝑒𝑑 𝑙𝑎𝑛𝑑 𝑎𝑟𝑒𝑎. 𝐻𝑢𝑚𝑎𝑛-𝑖𝑛𝑑𝑢𝑒𝑑 𝑐𝑙𝑖𝑚𝑎𝑡𝑒 𝑐ℎ𝑎𝑛𝑔𝑒 ℎ𝑎𝑠 𝑐𝑜𝑛𝑡𝑟𝑖𝑏𝑢𝑡𝑒𝑑 𝑡𝑜 𝑔𝑙𝑜𝑏𝑎𝑙-𝑠𝑐𝑎𝑙𝑒 𝑐ℎ𝑎𝑛𝑔𝑒 𝑖𝑛 𝑙𝑜𝑤 𝑓𝑙𝑜𝑤, 𝑏𝑢𝑡 𝒉𝒖𝒎𝒂𝒏 𝒘𝒂𝒕𝒆𝒓 𝒎𝒂𝒏𝒂𝒈𝒆𝒎𝒆𝒏𝒕 𝒂𝒏𝒅 𝒍𝒂𝒏𝒅-𝒖𝒔𝒆 𝒄𝒉𝒂𝒏𝒈𝒆𝒔 𝒂𝒓𝒆 𝒂𝒍𝒔𝒐 𝒊𝒎𝒑𝒐𝒓𝒕𝒂𝒏𝒕 𝒅𝒓𝒊𝒗𝒆𝒓𝒔.”
ipcc.ch/report/ar6/wg1
As a supplement, Vicente-Serrano et al. (2022) examined temporal changes in various drought types. Their analysis concluded similarly that,
“𝑨 𝒈𝒍𝒐𝒃𝒂𝒍 𝒊𝒏𝒄𝒓𝒆𝒂𝒔𝒆 𝒊𝒏 𝒕𝒉𝒆 𝒔𝒆𝒗𝒆𝒓𝒊𝒕𝒚 𝒐𝒇 𝒎𝒆𝒕𝒆𝒐𝒓𝒐𝒍𝒐𝒈𝒊𝒄𝒂𝒍 𝒅𝒓𝒐𝒖𝒈𝒉𝒕 𝒊𝒔 𝒏𝒐𝒕 𝒔𝒖𝒑𝒑𝒐𝒓𝒕𝒆𝒅 𝑏𝑦 𝑡ℎ𝑒 𝑎𝑛𝑎𝑙𝑦𝑠𝑖𝑠 𝑜𝑓 𝑝𝑟𝑒𝑐𝑖𝑝𝑖𝑡𝑎𝑡𝑖𝑜𝑛 𝑑𝑒𝑓𝑖𝑐𝑖𝑡𝑠, 𝑎𝑠 𝑜𝑛𝑙𝑦 𝑎 𝑓𝑒𝑤 𝑟𝑒𝑔𝑖𝑜𝑛𝑠 𝑜𝑓 𝑡ℎ𝑒 𝑤𝑜𝑟𝑙𝑑 𝑠ℎ𝑜𝑤 𝑎𝑛 𝑖𝑛𝑐𝑟𝑒𝑎𝑠𝑒 𝑖𝑛 𝑡ℎ𝑒 𝑠𝑒𝑣𝑒𝑟𝑖𝑡𝑦 𝑜𝑓 𝑚𝑒𝑡𝑒𝑜𝑟𝑜𝑙𝑜𝑔𝑖𝑐𝑎𝑙 𝑑𝑟𝑜𝑢𝑔ℎ𝑡𝑠.”
Additionally, the study found that changes in hydrological droughts were not due to human-caused climate change, but instead were related to other man-made influences such as land use change,
“𝑰𝒏𝒄𝒓𝒆𝒂𝒔𝒆𝒔 𝑖𝑛 𝑡ℎ𝑒 𝑓𝑟𝑒𝑞𝑢𝑒𝑛𝑐𝑦 𝑎𝑛𝑑 𝑠𝑒𝑣𝑒𝑟𝑖𝑡𝑦 𝑜𝑓 𝒉𝒚𝒅𝒓𝒐𝒍𝒐𝒈𝒊𝒄𝒂𝒍 𝒅𝒓𝒐𝒖𝒈𝒉𝒕𝒔 𝑐𝑎𝑛 𝑏𝑒 𝑡𝑟𝑎𝑐𝑒𝑑 𝑖𝑛 𝑝𝑎𝑟𝑡 𝑡𝑜 ℎ𝑢𝑚𝑎𝑛 𝑎𝑐𝑡𝑖𝑣𝑖𝑡𝑖𝑒𝑠 𝑠𝑢𝑐ℎ 𝑎𝑠 𝒍𝒂𝒏𝒅 𝒖𝒔𝒆 𝒄𝒉𝒂𝒏𝒈𝒆 𝒂𝒏𝒅 𝒂𝒈𝒓𝒊𝒄𝒖𝒍𝒕𝒖𝒓𝒂𝒍 𝒊𝒏𝒕𝒆𝒏𝒔𝒊𝒇𝒊𝒄𝒂𝒕𝒊𝒐𝒏 (𝑒.𝑔., 𝑡ℎ𝑒 𝑀𝑒𝑑𝑖𝑡𝑒𝑟𝑟𝑎𝑛𝑒𝑎𝑛 𝑎𝑟𝑒𝑎, 𝑁𝑜𝑟𝑡ℎ𝑒𝑎𝑠𝑡 𝐵𝑟𝑎𝑧𝑖𝑙).”
royalsocietypublishing.org/doi/10.1098/rs
Strike three!
You're out. But, I'll make that one a ball and give you one more shot.
𝐃𝐄𝐑𝐄𝐂𝐇𝐎𝐒 / 𝐂𝐎𝐍𝐕𝐄𝐂𝐓𝐈𝐕𝐄 𝐒𝐓𝐎𝐑𝐌𝐒  Derechos in particular are not assessed in-depth in the IPCC reports. But, it does fall under the umbrella term “severe convective storms”
Here's what the AR6 report has to say on those.
On detection, Chapter 11, Section 7.3.2,
“𝐼𝑛 𝑠𝑢𝑚𝑚𝑎𝑟𝑦, 𝑏𝑒𝑐𝑎𝑢𝑠𝑒 𝑡ℎ𝑒 𝑑𝑒𝑓𝑖𝑛𝑖𝑡𝑖𝑜𝑛 𝑜𝑓 𝑠𝑒𝑣𝑒𝑟𝑒 𝑐𝑜𝑛𝑣𝑒𝑐𝑡𝑖𝑣𝑒 𝑠𝑡𝑜𝑟𝑚𝑠 𝑣𝑎𝑟𝑖𝑒𝑠 𝑑𝑒𝑝𝑒𝑛𝑑𝑖𝑛𝑔 𝑜𝑛 𝑡ℎ𝑒 𝑙𝑖𝑡𝑒𝑟𝑎𝑡𝑢𝑟𝑒 𝑎𝑛𝑑 𝑟𝑒𝑔𝑖𝑜𝑛, 𝑖𝑡 𝑖𝑠 𝒏𝒐𝒕 𝒔𝒕𝒓𝒂𝒊𝒈𝒉𝒕𝒇𝒐𝒓𝒘𝒂𝒓𝒅 𝒕𝒐 𝒎𝒂𝒌𝒆 𝒂 𝒔𝒚𝒏𝒕𝒉𝒆𝒔𝒊𝒛𝒊𝒏𝒈 𝒓𝒆𝒗𝒊𝒆𝒘 𝒐𝒇 𝒐𝒃𝒔𝒆𝒓𝒗𝒆𝒅 𝒕𝒓𝒆𝒏𝒅𝒔 𝑖𝑛 𝑠𝑒𝑣𝑒𝑟𝑒 𝑐𝑜𝑛𝑣𝑒𝑐𝑡𝑖𝑣𝑒 𝑠𝑡𝑜𝑟𝑚𝑠 𝑖𝑛 𝑑𝑖𝑓𝑓𝑒𝑟𝑒𝑛𝑡 𝑟𝑒𝑔𝑖𝑜𝑛𝑠.”
ipcc.ch/report/ar6/wg1
On attribution, Chapter 11, Section 7.3.4,
“𝐼𝑛 𝑠𝑢𝑚𝑚𝑎𝑟𝑦, 𝑖𝑡 𝑖𝑠 𝑒𝑥𝑡𝑟𝑒𝑚𝑒𝑙𝑦 𝑑𝑖𝑓𝑓𝑖𝑐𝑢𝑙𝑡 𝑡𝑜 𝑑𝑒𝑡𝑒𝑐𝑡 𝑎𝑛𝑑 𝑎𝑡𝑡𝑟𝑖𝑏𝑢𝑡𝑒 𝑐ℎ𝑎𝑛𝑔𝑒𝑠 𝑖𝑛 𝑠𝑒𝑣𝑒𝑟𝑒 𝑐𝑜𝑛𝑣𝑒𝑐𝑡𝑖𝑣𝑒 𝑠𝑡𝑜𝑟𝑚𝑠. 𝑇ℎ𝑒𝑟𝑒 𝑖𝑠 𝒍𝒊𝒎𝒊𝒕𝒆𝒅 𝒆𝒗𝒊𝒅𝒆𝒏𝒄𝒆 𝑡ℎ𝑎𝑡 𝑒𝑥𝑡𝑟𝑒𝑚𝑒 𝑝𝑟𝑒𝑐𝑖𝑝𝑖𝑡𝑎𝑡𝑖𝑜𝑛 𝑎𝑠𝑠𝑜𝑐𝑖𝑎𝑡𝑒𝑑 𝑤𝑖𝑡ℎ 𝑠𝑒𝑣𝑒𝑟𝑒 𝑐𝑜𝑛𝑣𝑒𝑐𝑡𝑖𝑣𝑒 𝑠𝑡𝑜𝑟𝑚𝑠 ℎ𝑎𝑠 𝑖𝑛𝑐𝑟𝑒𝑎𝑠𝑒𝑑 𝑖𝑛 𝑠𝑜𝑚𝑒 𝑐𝑎𝑠𝑒𝑠.”
ipcc.ch/report/ar6/wg1
NOAA's Stephen Corfidi has a FAQ page on derechos, however, and here's what he has to say,
“A warmer planet at first glance would appear to be more conducive to the development of the intense thunderstorms that comprise derecho-producing convective systems. But thunderstorm updrafts require the presence of strong vertical temperature gradients; any warming occurring at the surface likely also would occur aloft. Thus, 𝒕𝒉𝒆 𝒏𝒆𝒕 𝒄𝒉𝒂𝒏𝒈𝒆 𝒊𝒏 𝒊𝒏𝒔𝒕𝒂𝒃𝒊𝒍𝒊𝒕𝒚 𝒅𝒖𝒆 𝒕𝒐 𝒕𝒉𝒆𝒓𝒎𝒂𝒍 𝒄𝒉𝒂𝒏𝒈𝒆𝒔 𝒍𝒊𝒌𝒆𝒍𝒚 𝒘𝒐𝒖𝒍𝒅 𝒃𝒆 𝒎𝒊𝒏𝒊𝒎𝒂𝒍. And, although a warmer environment implies greater atmospheric moisture content and conditional instability (instability related to the release of latent heat during condensation), all other factors remaining equal, the 𝒊𝒏𝒄𝒓𝒆𝒂𝒔𝒆𝒅 𝒎𝒐𝒊𝒔𝒕𝒖𝒓𝒆 𝒍𝒊𝒌𝒆𝒍𝒚 𝒂𝒍𝒔𝒐 𝒘𝒐𝒖𝒍𝒅 𝒚𝒊𝒆𝒍𝒅 𝒎𝒐𝒓𝒆 𝒘𝒊𝒅𝒆𝒔𝒑𝒓𝒆𝒂𝒅 𝒍𝒐𝒘-𝒍𝒆𝒗𝒆𝒍 𝒄𝒍𝒐𝒖𝒅 𝒄𝒐𝒗𝒆𝒓. 𝑺𝒖𝒄𝒉 𝒄𝒍𝒐𝒖𝒅𝒊𝒏𝒆𝒔𝒔 𝒘𝒐𝒖𝒍𝒅 𝒏𝒆𝒈𝒂𝒕𝒊𝒗𝒆𝒍𝒚 𝒊𝒎𝒑𝒂𝒄𝒕 𝒔𝒕𝒐𝒓𝒎 𝒊𝒏𝒊𝒕𝒊𝒂𝒕𝒊𝒐𝒏 𝒂𝒏𝒅 𝒅𝒆𝒓𝒆𝒄𝒉𝒐 𝒅𝒆𝒗𝒆𝒍𝒐𝒑𝒎𝒆𝒏𝒕. What is more certain is that the band of enhanced upper-level flow that encircles the planet — the jet stream — would contract poleward in a warmer world. Because derechos tend to form on the equatorward side of the jet stream along the northern fringes of warm high pressure ("fair weather") systems, it is reasonable to conclude that the corridors of maximum derecho frequency would shift poleward with global warming.”
spc.noaa.gov/misc/AbtDerech
Strike three.
It's over.
You got sacked.
Wave the white flag now.
Derechos in particular are not assessed in-depth in the IPCC reports. But, it does fall under the umbrella term “severe convective storms”
Here's what the AR6 report has to say on those.
On detection, Chapter 11, Section 7.3.2,
“𝐼𝑛 𝑠𝑢𝑚𝑚𝑎𝑟𝑦, 𝑏𝑒𝑐𝑎𝑢𝑠𝑒 𝑡ℎ𝑒 𝑑𝑒𝑓𝑖𝑛𝑖𝑡𝑖𝑜𝑛 𝑜𝑓 𝑠𝑒𝑣𝑒𝑟𝑒 𝑐𝑜𝑛𝑣𝑒𝑐𝑡𝑖𝑣𝑒 𝑠𝑡𝑜𝑟𝑚𝑠 𝑣𝑎𝑟𝑖𝑒𝑠 𝑑𝑒𝑝𝑒𝑛𝑑𝑖𝑛𝑔 𝑜𝑛 𝑡ℎ𝑒 𝑙𝑖𝑡𝑒𝑟𝑎𝑡𝑢𝑟𝑒 𝑎𝑛𝑑 𝑟𝑒𝑔𝑖𝑜𝑛, 𝑖𝑡 𝑖𝑠 𝒏𝒐𝒕 𝒔𝒕𝒓𝒂𝒊𝒈𝒉𝒕𝒇𝒐𝒓𝒘𝒂𝒓𝒅 𝒕𝒐 𝒎𝒂𝒌𝒆 𝒂 𝒔𝒚𝒏𝒕𝒉𝒆𝒔𝒊𝒛𝒊𝒏𝒈 𝒓𝒆𝒗𝒊𝒆𝒘 𝒐𝒇 𝒐𝒃𝒔𝒆𝒓𝒗𝒆𝒅 𝒕𝒓𝒆𝒏𝒅𝒔 𝑖𝑛 𝑠𝑒𝑣𝑒𝑟𝑒 𝑐𝑜𝑛𝑣𝑒𝑐𝑡𝑖𝑣𝑒 𝑠𝑡𝑜𝑟𝑚𝑠 𝑖𝑛 𝑑𝑖𝑓𝑓𝑒𝑟𝑒𝑛𝑡 𝑟𝑒𝑔𝑖𝑜𝑛𝑠.”
ipcc.ch/report/ar6/wg1
On attribution, Chapter 11, Section 7.3.4,
“𝐼𝑛 𝑠𝑢𝑚𝑚𝑎𝑟𝑦, 𝑖𝑡 𝑖𝑠 𝑒𝑥𝑡𝑟𝑒𝑚𝑒𝑙𝑦 𝑑𝑖𝑓𝑓𝑖𝑐𝑢𝑙𝑡 𝑡𝑜 𝑑𝑒𝑡𝑒𝑐𝑡 𝑎𝑛𝑑 𝑎𝑡𝑡𝑟𝑖𝑏𝑢𝑡𝑒 𝑐ℎ𝑎𝑛𝑔𝑒𝑠 𝑖𝑛 𝑠𝑒𝑣𝑒𝑟𝑒 𝑐𝑜𝑛𝑣𝑒𝑐𝑡𝑖𝑣𝑒 𝑠𝑡𝑜𝑟𝑚𝑠. 𝑇ℎ𝑒𝑟𝑒 𝑖𝑠 𝒍𝒊𝒎𝒊𝒕𝒆𝒅 𝒆𝒗𝒊𝒅𝒆𝒏𝒄𝒆 𝑡ℎ𝑎𝑡 𝑒𝑥𝑡𝑟𝑒𝑚𝑒 𝑝𝑟𝑒𝑐𝑖𝑝𝑖𝑡𝑎𝑡𝑖𝑜𝑛 𝑎𝑠𝑠𝑜𝑐𝑖𝑎𝑡𝑒𝑑 𝑤𝑖𝑡ℎ 𝑠𝑒𝑣𝑒𝑟𝑒 𝑐𝑜𝑛𝑣𝑒𝑐𝑡𝑖𝑣𝑒 𝑠𝑡𝑜𝑟𝑚𝑠 ℎ𝑎𝑠 𝑖𝑛𝑐𝑟𝑒𝑎𝑠𝑒𝑑 𝑖𝑛 𝑠𝑜𝑚𝑒 𝑐𝑎𝑠𝑒𝑠.”
ipcc.ch/report/ar6/wg1
NOAA's Stephen Corfidi has a FAQ page on derechos, however, and here's what he has to say,
“A warmer planet at first glance would appear to be more conducive to the development of the intense thunderstorms that comprise derecho-producing convective systems. But thunderstorm updrafts require the presence of strong vertical temperature gradients; any warming occurring at the surface likely also would occur aloft. Thus, 𝒕𝒉𝒆 𝒏𝒆𝒕 𝒄𝒉𝒂𝒏𝒈𝒆 𝒊𝒏 𝒊𝒏𝒔𝒕𝒂𝒃𝒊𝒍𝒊𝒕𝒚 𝒅𝒖𝒆 𝒕𝒐 𝒕𝒉𝒆𝒓𝒎𝒂𝒍 𝒄𝒉𝒂𝒏𝒈𝒆𝒔 𝒍𝒊𝒌𝒆𝒍𝒚 𝒘𝒐𝒖𝒍𝒅 𝒃𝒆 𝒎𝒊𝒏𝒊𝒎𝒂𝒍. And, although a warmer environment implies greater atmospheric moisture content and conditional instability (instability related to the release of latent heat during condensation), all other factors remaining equal, the 𝒊𝒏𝒄𝒓𝒆𝒂𝒔𝒆𝒅 𝒎𝒐𝒊𝒔𝒕𝒖𝒓𝒆 𝒍𝒊𝒌𝒆𝒍𝒚 𝒂𝒍𝒔𝒐 𝒘𝒐𝒖𝒍𝒅 𝒚𝒊𝒆𝒍𝒅 𝒎𝒐𝒓𝒆 𝒘𝒊𝒅𝒆𝒔𝒑𝒓𝒆𝒂𝒅 𝒍𝒐𝒘-𝒍𝒆𝒗𝒆𝒍 𝒄𝒍𝒐𝒖𝒅 𝒄𝒐𝒗𝒆𝒓. 𝑺𝒖𝒄𝒉 𝒄𝒍𝒐𝒖𝒅𝒊𝒏𝒆𝒔𝒔 𝒘𝒐𝒖𝒍𝒅 𝒏𝒆𝒈𝒂𝒕𝒊𝒗𝒆𝒍𝒚 𝒊𝒎𝒑𝒂𝒄𝒕 𝒔𝒕𝒐𝒓𝒎 𝒊𝒏𝒊𝒕𝒊𝒂𝒕𝒊𝒐𝒏 𝒂𝒏𝒅 𝒅𝒆𝒓𝒆𝒄𝒉𝒐 𝒅𝒆𝒗𝒆𝒍𝒐𝒑𝒎𝒆𝒏𝒕. What is more certain is that the band of enhanced upper-level flow that encircles the planet — the jet stream — would contract poleward in a warmer world. Because derechos tend to form on the equatorward side of the jet stream along the northern fringes of warm high pressure ("fair weather") systems, it is reasonable to conclude that the corridors of maximum derecho frequency would shift poleward with global warming.”
spc.noaa.gov/misc/AbtDerech
Strike three.
It's over.
You got sacked.
Wave the white flag now. James J. McGrath

 𝐓𝐇𝐄 “𝟗𝟕% 𝐂𝐎𝐍𝐄𝐒𝐍𝐒𝐔𝐒”
The paper that got this all started was published in ERL in 2013.
iopscience.iop.org/article/10.108
Led by cognitive psychologist John Cook—a Senior Research Fellow at the Melbourne Centre for Behaviour Change and founder of the climate blog, Skeptical Science—he and eight co-authors skimmed the abstracts of 11,944 climate-related papers published between 1991 and 2011.
Of the 11,944 abstracts, a total of 7,930 (66.4%) of them expressed 𝒏𝒐 𝒑𝒐𝒔𝒊𝒕𝒊𝒐𝒏 on the cause(s) of global warming since the pre-industrial era.
Of the remaining 4,014 abstracts that endorsed either anthropogenic global warming (AGW) or natural global warming, 3,896 (97.1%) endorsed AGW in at least some capacity, while 78 (1.9%) questioned or rejected AGW. The remaining 40 (1%) of papers expressed uncertainty.
But, it gets even more nuanced than that if we look at the abstracts and pick them apart. On whether global warming is being caused entirely by human activities, by nature, or by a combination of both, of those 4,014 papers, they state warming is caused:
𝐓𝐇𝐄 “𝟗𝟕% 𝐂𝐎𝐍𝐄𝐒𝐍𝐒𝐔𝐒”
The paper that got this all started was published in ERL in 2013.
iopscience.iop.org/article/10.108
Led by cognitive psychologist John Cook—a Senior Research Fellow at the Melbourne Centre for Behaviour Change and founder of the climate blog, Skeptical Science—he and eight co-authors skimmed the abstracts of 11,944 climate-related papers published between 1991 and 2011.
Of the 11,944 abstracts, a total of 7,930 (66.4%) of them expressed 𝒏𝒐 𝒑𝒐𝒔𝒊𝒕𝒊𝒐𝒏 on the cause(s) of global warming since the pre-industrial era.
Of the remaining 4,014 abstracts that endorsed either anthropogenic global warming (AGW) or natural global warming, 3,896 (97.1%) endorsed AGW in at least some capacity, while 78 (1.9%) questioned or rejected AGW. The remaining 40 (1%) of papers expressed uncertainty.
But, it gets even more nuanced than that if we look at the abstracts and pick them apart. On whether global warming is being caused entirely by human activities, by nature, or by a combination of both, of those 4,014 papers, they state warming is caused:
 Entirely by humans: 64 papers (1.59%)
 >>50% by humans: 922 (22.96%)
 Equally natural + man-made: 2,910 (72.50%)
 >>50% by natural cycles: 54 (1.35%)
 Man is causing no warming: 24 (0.60%)
 Don't know: 40 (1.00%)
So, a “97% consensus” can be contrived by either (a) omitting the 7,930 (66.4% of) abstracts in the 11,944-paper sample that did not explicitly state a position on the drivers of global warming, or by (b) lumping all 3,896 abstracts that endorsed at least some anthropogenic component as entirely endorsing AGW.
Either way, that's sausage-making.
Don't know: 40 (1.00%)
So, a “97% consensus” can be contrived by either (a) omitting the 7,930 (66.4% of) abstracts in the 11,944-paper sample that did not explicitly state a position on the drivers of global warming, or by (b) lumping all 3,896 abstracts that endorsed at least some anthropogenic component as entirely endorsing AGW.
Either way, that's sausage-making.  But, what about the >99% consensus?
𝐓𝐇𝐄 “>𝟗𝟗% 𝐂𝐎𝐍𝐄𝐒𝐍𝐒𝐔𝐒”
Like Cook et al. (2013), Lynas et al. (2021) attempted to quantify the consensus on AGW.
iopscience.iop.org/article/10.108
In this synthesis, 3,000 climate papers were selected at random. In that batch, 282 were marked as false positives since they weren't actually climate-related. That’s fair. So, the analysis continued with the remaining 2,718 peer-reviewed articles.
Of those, 1,869 (68.8%) of them took 𝒏𝒐 𝒑𝒐𝒔𝒊𝒕𝒊𝒐𝒏 on AGW. And, like Cook et al. (2013), all 1,869 papers neither endorsing nor rejecting AGW were discarded. Of the remaining 849 papers that did endorse a position, 845 (99.5%) of them sided with AGW while four did not.
So, like Cook et al. (2013), Lynas et al. (2021) ignored over 65% of the papers selected that didn't take one position or the other on the physical driver(s) of global warming. By doing this, the authors could artificially manufacture a consensus on an issue where none actually existed if all of the relevant papers were considered.
The advantage that Lynas et al. (2021) has over Cook et al. (2013) is that each paper was examined thoroughly rather than just the abstract. This made for a more thorough analysis despite the same flawed methodology both used in ignoring the majority of papers that took a neutral stance.
𝐁𝐮𝐭, 𝐰𝐚𝐢𝐭, 𝐭𝐡𝐞𝐫𝐞'𝐬 𝐦𝐨𝐫𝐞. . .
Climate activists will argue that the authors of Cook et al. (2013) and Lynas et al. (2021) were justified in excluding the 66.4% and 68.8% of papers, respectively, that did not express a position, on the grounds that those studies did not focus on identifying or discussing causal links.
But, that's just hand-waving.
But, what about the >99% consensus?
𝐓𝐇𝐄 “>𝟗𝟗% 𝐂𝐎𝐍𝐄𝐒𝐍𝐒𝐔𝐒”
Like Cook et al. (2013), Lynas et al. (2021) attempted to quantify the consensus on AGW.
iopscience.iop.org/article/10.108
In this synthesis, 3,000 climate papers were selected at random. In that batch, 282 were marked as false positives since they weren't actually climate-related. That’s fair. So, the analysis continued with the remaining 2,718 peer-reviewed articles.
Of those, 1,869 (68.8%) of them took 𝒏𝒐 𝒑𝒐𝒔𝒊𝒕𝒊𝒐𝒏 on AGW. And, like Cook et al. (2013), all 1,869 papers neither endorsing nor rejecting AGW were discarded. Of the remaining 849 papers that did endorse a position, 845 (99.5%) of them sided with AGW while four did not.
So, like Cook et al. (2013), Lynas et al. (2021) ignored over 65% of the papers selected that didn't take one position or the other on the physical driver(s) of global warming. By doing this, the authors could artificially manufacture a consensus on an issue where none actually existed if all of the relevant papers were considered.
The advantage that Lynas et al. (2021) has over Cook et al. (2013) is that each paper was examined thoroughly rather than just the abstract. This made for a more thorough analysis despite the same flawed methodology both used in ignoring the majority of papers that took a neutral stance.
𝐁𝐮𝐭, 𝐰𝐚𝐢𝐭, 𝐭𝐡𝐞𝐫𝐞'𝐬 𝐦𝐨𝐫𝐞. . .
Climate activists will argue that the authors of Cook et al. (2013) and Lynas et al. (2021) were justified in excluding the 66.4% and 68.8% of papers, respectively, that did not express a position, on the grounds that those studies did not focus on identifying or discussing causal links.
But, that's just hand-waving.  The fact is that not all of the studies endorsing AGW investigated the physical driver(s) of temperature change since 1850. In fact, in order to qualify as endorsing (or rejecting) AGW, a paper merely needed to take a stance on the issue, regardless of whether or not the study's focus was on the physical drivers of climate change.
You will find when reading through the literature that even papers challenging the conventional narrative—such as on topics like climate model performance, trends in extreme weather, and/or the efficacy of “net zero” policies—almost always include the disclaimer that mankind's carbon dioxide (CO₂) emissions are the proximate cause of all global warming. This is done so that the paper satisfies reviewers and journal editors enough to get accepted for publication. This is the science equivalent of a land acknowledgement to be in good standing with gatekeepers.
Another point I should add about Cook et al. (2013) and Lynas et al. (2021) is that neither paper frame their findings as being a reflection of the “consensus of scientists.” So, when climate activists claim that 97-99% of experts agree, that's not accurately stating what these studies purport.
𝐒𝐜𝐢𝐞𝐧𝐭𝐢𝐟𝐢𝐜 𝐂𝐨𝐧𝐬𝐞𝐧𝐬𝐮𝐬 𝐯𝐬. 𝐂𝐨𝐧𝐬𝐞𝐧𝐬𝐮𝐬 𝐨𝐟 𝐒𝐜𝐢𝐞𝐧𝐭𝐢𝐬𝐭𝐬
Another point I should add about Cook et al. (2013) and Lynas et al. (2021) is that neither paper frame their findings as being a reflection of the “consensus of scientists.” So, when climate activists claim that 97-99% of experts agree, that's not at all an accurate framing of these papers' findings.
The papers actually attempted to quantify the “scientific consensus” on AGW, which is a consensus of what the published literature says. That is different from a “consensus of scientists,” which is essentially nothing more than an expert opinion poll.
What's more, neither of these reviews addressed the million-dollar question, which is whether or not global warming has been [or will be] dangerous. Just because our GHG emissions 𝑚𝑎𝑦 have caused some [or even most of the warming] since the onset of the Industrial Revolution, that tells us nothing about the level of danger posed by it short- and long-term.
So, what do we actually know about what scientists think about (a) the cause(s) of global warming and (b) whether or not they think it is dangerous?
Thankfully, we have some insight into that.
𝐖𝐇𝐀𝐓 𝐒𝐂𝐈𝐄𝐍𝐓𝐈𝐒𝐓𝐒 𝐓𝐇𝐈𝐍𝐊
While a “consensus of scientists” (i.e., expert opinion poll) is less robust than a “scientific consensus” (i.e., synthesis of published literature), one advantage that polling scientists for their opinion has over the latter is that it gives them anonymity to express their views on the issue without having to fear losing their job or having their paper(s) rejected by biased journal editors (the gatekeepers).
Prestigious, lauded scientific organizations such as the American Geophysical Union (AGU), the American Meteorological Society (AMS), and the Royal Society have manufactured a “consensus of scientists” by taking a very strong stance on the climate issue without first consulting their members for their views.
Both the AGU and AMS recently did just that following the Trump administration's decision to repeal the Obama-era 2009 Endangerment Finding that allowed the EPA to regulate tailpipe emissions.
From the AGU,
The fact is that not all of the studies endorsing AGW investigated the physical driver(s) of temperature change since 1850. In fact, in order to qualify as endorsing (or rejecting) AGW, a paper merely needed to take a stance on the issue, regardless of whether or not the study's focus was on the physical drivers of climate change.
You will find when reading through the literature that even papers challenging the conventional narrative—such as on topics like climate model performance, trends in extreme weather, and/or the efficacy of “net zero” policies—almost always include the disclaimer that mankind's carbon dioxide (CO₂) emissions are the proximate cause of all global warming. This is done so that the paper satisfies reviewers and journal editors enough to get accepted for publication. This is the science equivalent of a land acknowledgement to be in good standing with gatekeepers.
Another point I should add about Cook et al. (2013) and Lynas et al. (2021) is that neither paper frame their findings as being a reflection of the “consensus of scientists.” So, when climate activists claim that 97-99% of experts agree, that's not accurately stating what these studies purport.
𝐒𝐜𝐢𝐞𝐧𝐭𝐢𝐟𝐢𝐜 𝐂𝐨𝐧𝐬𝐞𝐧𝐬𝐮𝐬 𝐯𝐬. 𝐂𝐨𝐧𝐬𝐞𝐧𝐬𝐮𝐬 𝐨𝐟 𝐒𝐜𝐢𝐞𝐧𝐭𝐢𝐬𝐭𝐬
Another point I should add about Cook et al. (2013) and Lynas et al. (2021) is that neither paper frame their findings as being a reflection of the “consensus of scientists.” So, when climate activists claim that 97-99% of experts agree, that's not at all an accurate framing of these papers' findings.
The papers actually attempted to quantify the “scientific consensus” on AGW, which is a consensus of what the published literature says. That is different from a “consensus of scientists,” which is essentially nothing more than an expert opinion poll.
What's more, neither of these reviews addressed the million-dollar question, which is whether or not global warming has been [or will be] dangerous. Just because our GHG emissions 𝑚𝑎𝑦 have caused some [or even most of the warming] since the onset of the Industrial Revolution, that tells us nothing about the level of danger posed by it short- and long-term.
So, what do we actually know about what scientists think about (a) the cause(s) of global warming and (b) whether or not they think it is dangerous?
Thankfully, we have some insight into that.
𝐖𝐇𝐀𝐓 𝐒𝐂𝐈𝐄𝐍𝐓𝐈𝐒𝐓𝐒 𝐓𝐇𝐈𝐍𝐊
While a “consensus of scientists” (i.e., expert opinion poll) is less robust than a “scientific consensus” (i.e., synthesis of published literature), one advantage that polling scientists for their opinion has over the latter is that it gives them anonymity to express their views on the issue without having to fear losing their job or having their paper(s) rejected by biased journal editors (the gatekeepers).
Prestigious, lauded scientific organizations such as the American Geophysical Union (AGU), the American Meteorological Society (AMS), and the Royal Society have manufactured a “consensus of scientists” by taking a very strong stance on the climate issue without first consulting their members for their views.
Both the AGU and AMS recently did just that following the Trump administration's decision to repeal the Obama-era 2009 Endangerment Finding that allowed the EPA to regulate tailpipe emissions.
From the AGU,
 “𝐴𝐺𝑈 𝑢𝑛𝑒𝑞𝑢𝑖𝑣𝑜𝑐𝑎𝑙𝑙𝑦 𝑐𝑜𝑛𝑑𝑒𝑚𝑛𝑠 𝑡ℎ𝑖𝑠 𝑟𝑒𝑐𝑘𝑙𝑒𝑠𝑠 𝑎𝑛𝑑 𝑠𝑒𝑛𝑠𝑒𝑙𝑒𝑠𝑠 𝑑𝑒𝑐𝑖𝑠𝑖𝑜𝑛, 𝑤ℎ𝑖𝑐ℎ ℎ𝑎𝑠 𝑔𝑙𝑜𝑏𝑎𝑙 𝑖𝑚𝑝𝑙𝑖𝑐𝑎𝑡𝑖𝑜𝑛𝑠 𝑓𝑜𝑟 ℎ𝑢𝑚𝑎𝑛 𝑤𝑒𝑙𝑙-𝑏𝑒𝑖𝑛𝑔 𝑎𝑛𝑑 𝑡ℎ𝑒 𝑒𝑛𝑣𝑖𝑟𝑜𝑛𝑚𝑒𝑛𝑡. 𝐼𝑡 𝑖𝑔𝑛𝑜𝑟𝑒𝑠 𝑡ℎ𝑒 𝑜𝑣𝑒𝑟𝑤ℎ𝑒𝑙𝑚𝑖𝑛𝑔 𝑒𝑣𝑖𝑑𝑒𝑛𝑐𝑒 𝑜𝑓 𝑐𝑙𝑖𝑚𝑎𝑡𝑒 𝑐ℎ𝑎𝑛𝑔𝑒’𝑠 𝑚𝑜𝑢𝑛𝑡𝑖𝑛𝑔 𝑡𝑜𝑙𝑙, 𝑓𝑟𝑜𝑚 𝑑𝑒𝑎𝑑𝑙𝑦 ℎ𝑒𝑎𝑡𝑤𝑎𝑣𝑒𝑠 𝑡𝑜 𝑟𝑖𝑠𝑖𝑛𝑔 𝑠𝑒𝑎 𝑙𝑒𝑣𝑒𝑙𝑠, 𝑎𝑛𝑑 𝑢𝑛𝑑𝑒𝑟𝑚𝑖𝑛𝑒𝑠 𝑑𝑒𝑐𝑎𝑑𝑒𝑠 𝑜𝑓 ℎ𝑎𝑟𝑑-𝑤𝑜𝑛 𝑝𝑟𝑜𝑔𝑟𝑒𝑠𝑠 𝑖𝑛 𝑏𝑢𝑖𝑙𝑑𝑖𝑛𝑔 𝑎 𝑓𝑜𝑢𝑛𝑑𝑎𝑡𝑖𝑜𝑛 𝑓𝑜𝑟 𝑐𝑙𝑖𝑚𝑎𝑡𝑒 𝑎𝑐𝑐𝑜𝑢𝑛𝑡𝑎𝑏𝑖𝑙𝑖𝑡𝑦. 𝑊𝑜𝑟𝑠𝑒 𝑠𝑡𝑖𝑙𝑙, 𝑖𝑡 𝑒𝑟𝑜𝑑𝑒𝑠 𝑝𝑢𝑏𝑙𝑖𝑐 𝑡𝑟𝑢𝑠𝑡 𝑖𝑛 𝑡ℎ𝑒 𝑟𝑜𝑙𝑒 𝑜𝑓 𝑠𝑐𝑖𝑒𝑛𝑐𝑒 𝑡𝑜 𝑖𝑛𝑓𝑜𝑟𝑚 𝑠𝑜𝑢𝑛𝑑 𝑝𝑜𝑙𝑖𝑐𝑦.”
fromtheprow.agu.org/agu-denounces-
And, from the AMS,
“𝑇ℎ𝑒 𝐴𝑚𝑒𝑟𝑖𝑐𝑎𝑛 𝑀𝑒𝑡𝑒𝑜𝑟𝑜𝑙𝑜𝑔𝑖𝑐𝑎𝑙 𝑆𝑜𝑐𝑖𝑒𝑡𝑦 (𝐴𝑀𝑆) 𝑖𝑠 𝑑𝑒𝑒𝑝𝑙𝑦 𝑐𝑜𝑛𝑐𝑒𝑟𝑛𝑒𝑑 𝑏𝑦 𝑡ℎ𝑒 𝑟𝑒𝑝𝑒𝑎𝑙 𝑜𝑓 𝐸𝑃𝐴’𝑠 2009 𝐸𝑛𝑑𝑎𝑛𝑔𝑒𝑟𝑚𝑒𝑛𝑡 𝐹𝑖𝑛𝑑𝑖𝑛𝑔, 𝑤ℎ𝑖𝑐ℎ 𝑐𝑜𝑟𝑟𝑒𝑐𝑡𝑙𝑦 𝑐𝑜𝑛𝑐𝑙𝑢𝑑𝑒𝑑 𝑡ℎ𝑎𝑡 𝑔𝑟𝑒𝑒𝑛ℎ𝑜𝑢𝑠𝑒 𝑔𝑎𝑠 𝑒𝑚𝑖𝑠𝑠𝑖𝑜𝑛𝑠 ℎ𝑎𝑟𝑚 ℎ𝑒𝑎𝑙𝑡ℎ 𝑎𝑛𝑑 𝑤𝑒𝑙𝑙-𝑏𝑒𝑖𝑛𝑔 𝑓𝑜𝑟 𝑐𝑢𝑟𝑟𝑒𝑛𝑡 𝑎𝑛𝑑 𝑓𝑢𝑡𝑢𝑟𝑒 𝑔𝑒𝑛𝑒𝑟𝑎𝑡𝑖𝑜𝑛𝑠.”
The letter continues, asserting without presenting a single shred of evidence, that,
“𝑇ℎ𝑒 𝑑𝑒𝑐𝑖𝑠𝑖𝑜𝑛𝑠 𝑜𝑓 𝑒𝑙𝑒𝑐𝑡𝑒𝑑 𝑜𝑓𝑓𝑖𝑐𝑖𝑎𝑙𝑠 𝑎𝑛𝑑 𝑝𝑢𝑏𝑙𝑖𝑐 𝑠𝑒𝑟𝑣𝑎𝑛𝑡𝑠 ℎ𝑎𝑣𝑒 𝑡ℎ𝑒 𝑔𝑟𝑒𝑎𝑡𝑒𝑠𝑡 𝑝𝑜𝑡𝑒𝑛𝑡𝑖𝑎𝑙 𝑡𝑜 𝑠𝑒𝑟𝑣𝑒 𝑡ℎ𝑒 𝑛𝑎𝑡𝑖𝑜𝑛 𝑤ℎ𝑒𝑛 𝑡ℎ𝑒𝑦 𝑎𝑟𝑒 𝑢𝑛𝑑𝑒𝑟𝑝𝑖𝑛𝑛𝑒𝑑 𝑏𝑦 𝑡ℎ𝑒 𝑏𝑒𝑠𝑡 𝑎𝑣𝑎𝑖𝑙𝑎𝑏𝑙𝑒 𝑠𝑐𝑖𝑒𝑛𝑡𝑖𝑓𝑖𝑐 𝑘𝑛𝑜𝑤𝑙𝑒𝑑𝑔𝑒 𝑎𝑛𝑑 𝑢𝑛𝑑𝑒𝑟𝑠𝑡𝑎𝑛𝑑𝑖𝑛𝑔. 𝑇ℎ𝑒 𝑟𝑒𝑝𝑒𝑎𝑙 𝑜𝑓 𝑡ℎ𝑒 𝐸𝑛𝑑𝑎𝑛𝑔𝑒𝑟𝑚𝑒𝑛𝑡 𝐹𝑖𝑛𝑑𝑖𝑛𝑔 𝑑𝑜𝑒𝑠 𝑛𝑜𝑡 𝑎𝑙𝑡𝑒𝑟 𝑡ℎ𝑒 𝑐𝑒𝑛𝑡𝑟𝑎𝑙 𝑢𝑛𝑎𝑚𝑏𝑖𝑔𝑢𝑜𝑢𝑠 𝑠𝑐𝑖𝑒𝑛𝑡𝑖𝑓𝑖𝑐 𝑐𝑜𝑛𝑐𝑙𝑢𝑠𝑖𝑜𝑛: 𝑇ℎ𝑒 𝑐𝑙𝑖𝑚𝑎𝑡𝑒 𝑐ℎ𝑎𝑛𝑔𝑒 𝑡ℎ𝑎𝑡 𝑝𝑒𝑜𝑝𝑙𝑒 𝑎𝑟𝑒 𝑐𝑎𝑢𝑠𝑖𝑛𝑔 𝑡ℎ𝑟𝑒𝑎𝑡𝑒𝑛𝑠 ℎ𝑢𝑚𝑎𝑛 𝑙𝑖𝑣𝑒𝑠 𝑎𝑛𝑑 𝑤𝑒𝑙𝑙-𝑏𝑒𝑖𝑛𝑔.”
ametsoc.org/ams/about-ams/
Both statements were written without consultation of each organization's professional members.
Contrary to the AMS' partisan take, we actually have good insight into what their members think about (a) the cause(s) of global warming and (b) whether or not they think warming is dangerous.
In January 2016, Dr. Ed Maibach and colleagues from George Mason University (GMU) polled all 7,682 (at that time) professional members of the AMS on their views on climate change. A handful of questions were asked with several follow-ups.
gmuchss.az1.qualtrics.com/CP/File.php?F=
The survey had a 53.3% participation rate and there were 4,092 respondents (p. 1).
Here are a sample of the questions asked:
“𝐴𝐺𝑈 𝑢𝑛𝑒𝑞𝑢𝑖𝑣𝑜𝑐𝑎𝑙𝑙𝑦 𝑐𝑜𝑛𝑑𝑒𝑚𝑛𝑠 𝑡ℎ𝑖𝑠 𝑟𝑒𝑐𝑘𝑙𝑒𝑠𝑠 𝑎𝑛𝑑 𝑠𝑒𝑛𝑠𝑒𝑙𝑒𝑠𝑠 𝑑𝑒𝑐𝑖𝑠𝑖𝑜𝑛, 𝑤ℎ𝑖𝑐ℎ ℎ𝑎𝑠 𝑔𝑙𝑜𝑏𝑎𝑙 𝑖𝑚𝑝𝑙𝑖𝑐𝑎𝑡𝑖𝑜𝑛𝑠 𝑓𝑜𝑟 ℎ𝑢𝑚𝑎𝑛 𝑤𝑒𝑙𝑙-𝑏𝑒𝑖𝑛𝑔 𝑎𝑛𝑑 𝑡ℎ𝑒 𝑒𝑛𝑣𝑖𝑟𝑜𝑛𝑚𝑒𝑛𝑡. 𝐼𝑡 𝑖𝑔𝑛𝑜𝑟𝑒𝑠 𝑡ℎ𝑒 𝑜𝑣𝑒𝑟𝑤ℎ𝑒𝑙𝑚𝑖𝑛𝑔 𝑒𝑣𝑖𝑑𝑒𝑛𝑐𝑒 𝑜𝑓 𝑐𝑙𝑖𝑚𝑎𝑡𝑒 𝑐ℎ𝑎𝑛𝑔𝑒’𝑠 𝑚𝑜𝑢𝑛𝑡𝑖𝑛𝑔 𝑡𝑜𝑙𝑙, 𝑓𝑟𝑜𝑚 𝑑𝑒𝑎𝑑𝑙𝑦 ℎ𝑒𝑎𝑡𝑤𝑎𝑣𝑒𝑠 𝑡𝑜 𝑟𝑖𝑠𝑖𝑛𝑔 𝑠𝑒𝑎 𝑙𝑒𝑣𝑒𝑙𝑠, 𝑎𝑛𝑑 𝑢𝑛𝑑𝑒𝑟𝑚𝑖𝑛𝑒𝑠 𝑑𝑒𝑐𝑎𝑑𝑒𝑠 𝑜𝑓 ℎ𝑎𝑟𝑑-𝑤𝑜𝑛 𝑝𝑟𝑜𝑔𝑟𝑒𝑠𝑠 𝑖𝑛 𝑏𝑢𝑖𝑙𝑑𝑖𝑛𝑔 𝑎 𝑓𝑜𝑢𝑛𝑑𝑎𝑡𝑖𝑜𝑛 𝑓𝑜𝑟 𝑐𝑙𝑖𝑚𝑎𝑡𝑒 𝑎𝑐𝑐𝑜𝑢𝑛𝑡𝑎𝑏𝑖𝑙𝑖𝑡𝑦. 𝑊𝑜𝑟𝑠𝑒 𝑠𝑡𝑖𝑙𝑙, 𝑖𝑡 𝑒𝑟𝑜𝑑𝑒𝑠 𝑝𝑢𝑏𝑙𝑖𝑐 𝑡𝑟𝑢𝑠𝑡 𝑖𝑛 𝑡ℎ𝑒 𝑟𝑜𝑙𝑒 𝑜𝑓 𝑠𝑐𝑖𝑒𝑛𝑐𝑒 𝑡𝑜 𝑖𝑛𝑓𝑜𝑟𝑚 𝑠𝑜𝑢𝑛𝑑 𝑝𝑜𝑙𝑖𝑐𝑦.”
fromtheprow.agu.org/agu-denounces-
And, from the AMS,
“𝑇ℎ𝑒 𝐴𝑚𝑒𝑟𝑖𝑐𝑎𝑛 𝑀𝑒𝑡𝑒𝑜𝑟𝑜𝑙𝑜𝑔𝑖𝑐𝑎𝑙 𝑆𝑜𝑐𝑖𝑒𝑡𝑦 (𝐴𝑀𝑆) 𝑖𝑠 𝑑𝑒𝑒𝑝𝑙𝑦 𝑐𝑜𝑛𝑐𝑒𝑟𝑛𝑒𝑑 𝑏𝑦 𝑡ℎ𝑒 𝑟𝑒𝑝𝑒𝑎𝑙 𝑜𝑓 𝐸𝑃𝐴’𝑠 2009 𝐸𝑛𝑑𝑎𝑛𝑔𝑒𝑟𝑚𝑒𝑛𝑡 𝐹𝑖𝑛𝑑𝑖𝑛𝑔, 𝑤ℎ𝑖𝑐ℎ 𝑐𝑜𝑟𝑟𝑒𝑐𝑡𝑙𝑦 𝑐𝑜𝑛𝑐𝑙𝑢𝑑𝑒𝑑 𝑡ℎ𝑎𝑡 𝑔𝑟𝑒𝑒𝑛ℎ𝑜𝑢𝑠𝑒 𝑔𝑎𝑠 𝑒𝑚𝑖𝑠𝑠𝑖𝑜𝑛𝑠 ℎ𝑎𝑟𝑚 ℎ𝑒𝑎𝑙𝑡ℎ 𝑎𝑛𝑑 𝑤𝑒𝑙𝑙-𝑏𝑒𝑖𝑛𝑔 𝑓𝑜𝑟 𝑐𝑢𝑟𝑟𝑒𝑛𝑡 𝑎𝑛𝑑 𝑓𝑢𝑡𝑢𝑟𝑒 𝑔𝑒𝑛𝑒𝑟𝑎𝑡𝑖𝑜𝑛𝑠.”
The letter continues, asserting without presenting a single shred of evidence, that,
“𝑇ℎ𝑒 𝑑𝑒𝑐𝑖𝑠𝑖𝑜𝑛𝑠 𝑜𝑓 𝑒𝑙𝑒𝑐𝑡𝑒𝑑 𝑜𝑓𝑓𝑖𝑐𝑖𝑎𝑙𝑠 𝑎𝑛𝑑 𝑝𝑢𝑏𝑙𝑖𝑐 𝑠𝑒𝑟𝑣𝑎𝑛𝑡𝑠 ℎ𝑎𝑣𝑒 𝑡ℎ𝑒 𝑔𝑟𝑒𝑎𝑡𝑒𝑠𝑡 𝑝𝑜𝑡𝑒𝑛𝑡𝑖𝑎𝑙 𝑡𝑜 𝑠𝑒𝑟𝑣𝑒 𝑡ℎ𝑒 𝑛𝑎𝑡𝑖𝑜𝑛 𝑤ℎ𝑒𝑛 𝑡ℎ𝑒𝑦 𝑎𝑟𝑒 𝑢𝑛𝑑𝑒𝑟𝑝𝑖𝑛𝑛𝑒𝑑 𝑏𝑦 𝑡ℎ𝑒 𝑏𝑒𝑠𝑡 𝑎𝑣𝑎𝑖𝑙𝑎𝑏𝑙𝑒 𝑠𝑐𝑖𝑒𝑛𝑡𝑖𝑓𝑖𝑐 𝑘𝑛𝑜𝑤𝑙𝑒𝑑𝑔𝑒 𝑎𝑛𝑑 𝑢𝑛𝑑𝑒𝑟𝑠𝑡𝑎𝑛𝑑𝑖𝑛𝑔. 𝑇ℎ𝑒 𝑟𝑒𝑝𝑒𝑎𝑙 𝑜𝑓 𝑡ℎ𝑒 𝐸𝑛𝑑𝑎𝑛𝑔𝑒𝑟𝑚𝑒𝑛𝑡 𝐹𝑖𝑛𝑑𝑖𝑛𝑔 𝑑𝑜𝑒𝑠 𝑛𝑜𝑡 𝑎𝑙𝑡𝑒𝑟 𝑡ℎ𝑒 𝑐𝑒𝑛𝑡𝑟𝑎𝑙 𝑢𝑛𝑎𝑚𝑏𝑖𝑔𝑢𝑜𝑢𝑠 𝑠𝑐𝑖𝑒𝑛𝑡𝑖𝑓𝑖𝑐 𝑐𝑜𝑛𝑐𝑙𝑢𝑠𝑖𝑜𝑛: 𝑇ℎ𝑒 𝑐𝑙𝑖𝑚𝑎𝑡𝑒 𝑐ℎ𝑎𝑛𝑔𝑒 𝑡ℎ𝑎𝑡 𝑝𝑒𝑜𝑝𝑙𝑒 𝑎𝑟𝑒 𝑐𝑎𝑢𝑠𝑖𝑛𝑔 𝑡ℎ𝑟𝑒𝑎𝑡𝑒𝑛𝑠 ℎ𝑢𝑚𝑎𝑛 𝑙𝑖𝑣𝑒𝑠 𝑎𝑛𝑑 𝑤𝑒𝑙𝑙-𝑏𝑒𝑖𝑛𝑔.”
ametsoc.org/ams/about-ams/
Both statements were written without consultation of each organization's professional members.
Contrary to the AMS' partisan take, we actually have good insight into what their members think about (a) the cause(s) of global warming and (b) whether or not they think warming is dangerous.
In January 2016, Dr. Ed Maibach and colleagues from George Mason University (GMU) polled all 7,682 (at that time) professional members of the AMS on their views on climate change. A handful of questions were asked with several follow-ups.
gmuchss.az1.qualtrics.com/CP/File.php?F=
The survey had a 53.3% participation rate and there were 4,092 respondents (p. 1).
Here are a sample of the questions asked:
 𝗥𝗲𝗴𝗮𝗿𝗱𝗹𝗲𝘀𝘀 𝗼𝗳 𝗰𝗮𝘂𝘀𝗲, 𝗱𝗼 𝘆𝗼𝘂 𝘁𝗵𝗶𝗻𝗸 𝗰𝗹𝗶𝗺𝗮𝘁𝗲 𝗰𝗵𝗮𝗻𝗴𝗲 𝗶𝘀 𝗵𝗮𝗽𝗽𝗲𝗻𝗶𝗻𝗴? (4,091 responses)
 Yes: 96%
 No: 1%
Don't know: 3%
✦ [Follow-up, only asked to those who answered “Yes” to 1] 𝗛𝗼𝘄 𝘀𝘂𝗿𝗲 𝗮𝗿𝗲 𝘆𝗼𝘂 𝘁𝗵𝗮𝘁 𝗰𝗹𝗶𝗺𝗮𝘁𝗲 𝗰𝗵𝗮𝗻𝗴𝗲 𝗶𝘀 𝗵𝗮𝗽𝗽𝗲𝗻𝗶𝗻𝗴? (3,854 responses)
Extremely sure: 58%
Very sure: 31%
Somewhat sure: 10%
Not sure: 0%
✦ [Follow-up, only asked to those who answered “No” to 1] 𝗛𝗼𝘄 𝘀𝘂𝗿𝗲 𝗮𝗿𝗲 𝘆𝗼𝘂 𝘁𝗵𝗮𝘁 𝗰𝗹𝗶𝗺𝗮𝘁𝗲 𝗰𝗵𝗮𝗻𝗴𝗲 𝗶𝘀 𝒏𝒐𝒕 𝗵𝗮𝗽𝗽𝗲𝗻𝗶𝗻𝗴? (53 responses)
Extremely sure: 13%
Very sure: 43%
Somewhat sure: 38%
Not sure: 6%
No: 1%
Don't know: 3%
✦ [Follow-up, only asked to those who answered “Yes” to 1] 𝗛𝗼𝘄 𝘀𝘂𝗿𝗲 𝗮𝗿𝗲 𝘆𝗼𝘂 𝘁𝗵𝗮𝘁 𝗰𝗹𝗶𝗺𝗮𝘁𝗲 𝗰𝗵𝗮𝗻𝗴𝗲 𝗶𝘀 𝗵𝗮𝗽𝗽𝗲𝗻𝗶𝗻𝗴? (3,854 responses)
Extremely sure: 58%
Very sure: 31%
Somewhat sure: 10%
Not sure: 0%
✦ [Follow-up, only asked to those who answered “No” to 1] 𝗛𝗼𝘄 𝘀𝘂𝗿𝗲 𝗮𝗿𝗲 𝘆𝗼𝘂 𝘁𝗵𝗮𝘁 𝗰𝗹𝗶𝗺𝗮𝘁𝗲 𝗰𝗵𝗮𝗻𝗴𝗲 𝗶𝘀 𝒏𝒐𝒕 𝗵𝗮𝗽𝗽𝗲𝗻𝗶𝗻𝗴? (53 responses)
Extremely sure: 13%
Very sure: 43%
Somewhat sure: 38%
Not sure: 6%
 𝗗𝗼 𝘆𝗼𝘂 𝘁𝗵𝗶𝗻𝗸 𝘁𝗵𝗮𝘁 𝘁𝗵𝗲 𝗰𝗹𝗶𝗺𝗮𝘁𝗲 𝗰𝗵𝗮𝗻𝗴𝗲 𝘁𝗵𝗮𝘁 𝗵𝗮𝘀 𝗼𝗰𝗰𝘂𝗿𝗿𝗲𝗱 𝗼𝘃𝗲𝗿 𝘁𝗵𝗲 𝗽𝗮𝘀𝘁 𝟱𝟬 𝘆𝗲𝗮𝗿𝘀 𝗵𝗮𝘀 𝗯𝗲𝗲𝗻 𝗰𝗮𝘂𝘀𝗲𝗱... (4,004 responses)
Largely / entirely by humans (>81%): 29%
Mostly by humans (60-80%): 38%
Roughly equally natural + man-made: 14%
Mostly by natural events (60-80%): 7%
Largely / entirely by natural events (>81%): 5%
Don't know: 6%
Climate has not changed: 1%
𝗗𝗼 𝘆𝗼𝘂 𝘁𝗵𝗶𝗻𝗸 𝘁𝗵𝗮𝘁 𝘁𝗵𝗲 𝗰𝗹𝗶𝗺𝗮𝘁𝗲 𝗰𝗵𝗮𝗻𝗴𝗲 𝘁𝗵𝗮𝘁 𝗵𝗮𝘀 𝗼𝗰𝗰𝘂𝗿𝗿𝗲𝗱 𝗼𝘃𝗲𝗿 𝘁𝗵𝗲 𝗽𝗮𝘀𝘁 𝟱𝟬 𝘆𝗲𝗮𝗿𝘀 𝗵𝗮𝘀 𝗯𝗲𝗲𝗻 𝗰𝗮𝘂𝘀𝗲𝗱... (4,004 responses)
Largely / entirely by humans (>81%): 29%
Mostly by humans (60-80%): 38%
Roughly equally natural + man-made: 14%
Mostly by natural events (60-80%): 7%
Largely / entirely by natural events (>81%): 5%
Don't know: 6%
Climate has not changed: 1%
 𝗧𝗼 𝘁𝗵𝗲 𝗯𝗲𝘀𝘁 𝗼𝗳 𝘆𝗼𝘂𝗿 𝗸𝗻𝗼𝘄𝗹𝗲𝗱𝗴𝗲, 𝗵𝗮𝘀 𝘁𝗵𝗲 𝗰𝗹𝗶𝗺𝗮𝘁𝗲 𝗶𝗻 𝘆𝗼𝘂𝗿 𝗮𝗿𝗲𝗮 𝗰𝗵𝗮𝗻𝗴𝗲𝗱 𝗼𝘃𝗲𝗿 𝘁𝗵𝗲 𝗽𝗮𝘀𝘁 𝟱𝟬 𝘆𝗲𝗮𝗿𝘀? (4,002 responses)
Yes: 74%
No: 11%
Don't know: 15%
✦ [Follow-up, only asked to those who answered “Yes” to 6] 𝗪𝗵𝗶𝗰𝗵 𝗼𝗳 𝘁𝗵𝗲 𝗳𝗼𝗹𝗹𝗼𝘄𝗶𝗻𝗴 𝗯𝗲𝘀𝘁 𝗱𝗲𝘀𝗰𝗿𝗶𝗯𝗲𝘀 𝘁𝗵𝗲 𝗶𝗺𝗽𝗮𝗰𝘁(𝘀) 𝗼𝗳 𝘁𝗵𝗲 𝗹𝗼𝗰𝗮𝗹 𝗰𝗹𝗶𝗺𝗮𝘁𝗲 𝗰𝗵𝗮𝗻𝗴𝗲 𝗶𝗻 𝘆𝗼𝘂𝗿 𝗮𝗿𝗲𝗮 𝗼𝘃𝗲𝗿 𝘁𝗵𝗲 𝗽𝗮𝘀𝘁 𝟱𝟬 𝘆𝗲𝗮𝗿𝘀? (3,546 responses)
Exclusively beneficial: 0%
Primarily beneficial: 4%
Equally mixed, beneficial + harmful: 36%
Primarily harmful: 36%
Exclusively harmful: 2%
Don't know: 21%
𝗧𝗼 𝘁𝗵𝗲 𝗯𝗲𝘀𝘁 𝗼𝗳 𝘆𝗼𝘂𝗿 𝗸𝗻𝗼𝘄𝗹𝗲𝗱𝗴𝗲, 𝗵𝗮𝘀 𝘁𝗵𝗲 𝗰𝗹𝗶𝗺𝗮𝘁𝗲 𝗶𝗻 𝘆𝗼𝘂𝗿 𝗮𝗿𝗲𝗮 𝗰𝗵𝗮𝗻𝗴𝗲𝗱 𝗼𝘃𝗲𝗿 𝘁𝗵𝗲 𝗽𝗮𝘀𝘁 𝟱𝟬 𝘆𝗲𝗮𝗿𝘀? (4,002 responses)
Yes: 74%
No: 11%
Don't know: 15%
✦ [Follow-up, only asked to those who answered “Yes” to 6] 𝗪𝗵𝗶𝗰𝗵 𝗼𝗳 𝘁𝗵𝗲 𝗳𝗼𝗹𝗹𝗼𝘄𝗶𝗻𝗴 𝗯𝗲𝘀𝘁 𝗱𝗲𝘀𝗰𝗿𝗶𝗯𝗲𝘀 𝘁𝗵𝗲 𝗶𝗺𝗽𝗮𝗰𝘁(𝘀) 𝗼𝗳 𝘁𝗵𝗲 𝗹𝗼𝗰𝗮𝗹 𝗰𝗹𝗶𝗺𝗮𝘁𝗲 𝗰𝗵𝗮𝗻𝗴𝗲 𝗶𝗻 𝘆𝗼𝘂𝗿 𝗮𝗿𝗲𝗮 𝗼𝘃𝗲𝗿 𝘁𝗵𝗲 𝗽𝗮𝘀𝘁 𝟱𝟬 𝘆𝗲𝗮𝗿𝘀? (3,546 responses)
Exclusively beneficial: 0%
Primarily beneficial: 4%
Equally mixed, beneficial + harmful: 36%
Primarily harmful: 36%
Exclusively harmful: 2%
Don't know: 21%
 𝗧𝗼 𝘁𝗵𝗲 𝗯𝗲𝘀𝘁 𝗼𝗳 𝘆𝗼𝘂𝗿 𝗸𝗻𝗼𝘄𝗹𝗲𝗱𝗴𝗲, 𝘄𝗶𝗹𝗹 𝘁𝗵𝗲 𝗹𝗼𝗰𝗮𝗹 𝗰𝗹𝗶𝗺𝗮𝘁𝗲 𝗶𝗻 𝘆𝗼𝘂𝗿 𝗮𝗿𝗲𝗮 𝗰𝗵𝗮𝗻𝗴𝗲 𝗼𝘃𝗲𝗿 𝘁𝗵𝗲 𝗻𝗲𝘅𝘁 𝟱𝟬 𝘆𝗲𝗮𝗿𝘀? (3,963 responses)
Yes: 78%
No: 5%
Don't know: 17%
✦ [Follow-up, only asked to those who answered “Yes” to 7] 𝗪𝗵𝗶𝗰𝗵 𝗼𝗳 𝘁𝗵𝗲 𝗳𝗼𝗹𝗹𝗼𝘄𝗶𝗻𝗴 𝗯𝗲𝘀𝘁 𝗱𝗲𝘀𝗰𝗿𝗶𝗯𝗲𝘀 𝘁𝗵𝗲 𝗶𝗺𝗽𝗮𝗰𝘁(𝘀) 𝗼𝗳 𝘁𝗵𝗲 𝗹𝗼𝗰𝗮𝗹 𝗰𝗹𝗶𝗺𝗮𝘁𝗲 𝗰𝗵𝗮𝗻𝗴𝗲 𝗶𝗻 𝘆𝗼𝘂𝗿 𝗮𝗿𝗲𝗮 𝗼𝘃𝗲𝗿 𝘁𝗵𝗲 𝗻𝗲𝘅𝘁 𝟱𝟬 𝘆𝗲𝗮𝗿𝘀? (3,761 responses)
Exclusively beneficial: 0%
Primarily beneficial: 2%
Equally mixed, beneficial + harmful: 29%
Primarily harmful: 47%
Exclusively harmful: 3%
Don't know: 19%
So, based on this 2016 survey of professional AMS members, of those who responded,
• 96% of AMS members agree that climate change is occurring, regardless of the proximate cause.
• 67% of AMS members agree that change has primarily been human-caused, but the contribution estimates vary considerably. 67% is far from a consensus given that 33% have a different opinion.
• 38% of AMS members agree that the impacts of climate change in their localities have been negative over the last 50 years. However, 40% said that the impacts have been mixed or primarily beneficial, and 21% said that they weren't sure.
So, what can we truly conclude about the “consensus of scientists” on climate change?
• Is climate change occurring?
• Human activities contribute to global warming in at least 𝑺𝑶𝑴𝑬 capacity?
• Climate change is [or will be] dangerous?
Thus, just because global warming is real and play a role in causing it is not a good enough justification to rapidly eliminate fossil fuels from the energy mix. There must be sufficient proof that this tiny warming poses a great threat to the welfare of the planet and life on it, and that has yet to be provided contrary to the letters written by the AGU and AMS.
It is clear from the survey results that there is greater disagreement among scientists than you are misled to believe. Federal government and university research scientists are often told what they can and cannot say publicly about climate change. I know that for a fact because I have family members and friends that are federal employees OR university faculty that would be fired immediately if they stated what they really think about the issue.
Either way, consensus isn't science.
Science requires only one investigator who happens to have verifiable data and evidence.
Climate alarmists have not done that. They provide a bunch of modeling studies and hypotheticals stacked on top of hypotheticals. But if you look at real-world data on the quality of life, it has never been better.
𝗧𝗼 𝘁𝗵𝗲 𝗯𝗲𝘀𝘁 𝗼𝗳 𝘆𝗼𝘂𝗿 𝗸𝗻𝗼𝘄𝗹𝗲𝗱𝗴𝗲, 𝘄𝗶𝗹𝗹 𝘁𝗵𝗲 𝗹𝗼𝗰𝗮𝗹 𝗰𝗹𝗶𝗺𝗮𝘁𝗲 𝗶𝗻 𝘆𝗼𝘂𝗿 𝗮𝗿𝗲𝗮 𝗰𝗵𝗮𝗻𝗴𝗲 𝗼𝘃𝗲𝗿 𝘁𝗵𝗲 𝗻𝗲𝘅𝘁 𝟱𝟬 𝘆𝗲𝗮𝗿𝘀? (3,963 responses)
Yes: 78%
No: 5%
Don't know: 17%
✦ [Follow-up, only asked to those who answered “Yes” to 7] 𝗪𝗵𝗶𝗰𝗵 𝗼𝗳 𝘁𝗵𝗲 𝗳𝗼𝗹𝗹𝗼𝘄𝗶𝗻𝗴 𝗯𝗲𝘀𝘁 𝗱𝗲𝘀𝗰𝗿𝗶𝗯𝗲𝘀 𝘁𝗵𝗲 𝗶𝗺𝗽𝗮𝗰𝘁(𝘀) 𝗼𝗳 𝘁𝗵𝗲 𝗹𝗼𝗰𝗮𝗹 𝗰𝗹𝗶𝗺𝗮𝘁𝗲 𝗰𝗵𝗮𝗻𝗴𝗲 𝗶𝗻 𝘆𝗼𝘂𝗿 𝗮𝗿𝗲𝗮 𝗼𝘃𝗲𝗿 𝘁𝗵𝗲 𝗻𝗲𝘅𝘁 𝟱𝟬 𝘆𝗲𝗮𝗿𝘀? (3,761 responses)
Exclusively beneficial: 0%
Primarily beneficial: 2%
Equally mixed, beneficial + harmful: 29%
Primarily harmful: 47%
Exclusively harmful: 3%
Don't know: 19%
So, based on this 2016 survey of professional AMS members, of those who responded,
• 96% of AMS members agree that climate change is occurring, regardless of the proximate cause.
• 67% of AMS members agree that change has primarily been human-caused, but the contribution estimates vary considerably. 67% is far from a consensus given that 33% have a different opinion.
• 38% of AMS members agree that the impacts of climate change in their localities have been negative over the last 50 years. However, 40% said that the impacts have been mixed or primarily beneficial, and 21% said that they weren't sure.
So, what can we truly conclude about the “consensus of scientists” on climate change?
• Is climate change occurring?
• Human activities contribute to global warming in at least 𝑺𝑶𝑴𝑬 capacity?
• Climate change is [or will be] dangerous?
Thus, just because global warming is real and play a role in causing it is not a good enough justification to rapidly eliminate fossil fuels from the energy mix. There must be sufficient proof that this tiny warming poses a great threat to the welfare of the planet and life on it, and that has yet to be provided contrary to the letters written by the AGU and AMS.
It is clear from the survey results that there is greater disagreement among scientists than you are misled to believe. Federal government and university research scientists are often told what they can and cannot say publicly about climate change. I know that for a fact because I have family members and friends that are federal employees OR university faculty that would be fired immediately if they stated what they really think about the issue.
Either way, consensus isn't science.
Science requires only one investigator who happens to have verifiable data and evidence.
Climate alarmists have not done that. They provide a bunch of modeling studies and hypotheticals stacked on top of hypotheticals. But if you look at real-world data on the quality of life, it has never been better.Why I’m Convinced That There is A “Greenhouse Effect” – Chris Martz
FossilFuels https://x.com/ChrisMartzWX/status/1924936898113323171

Comments
Post a Comment